Option Strategies
Introduction to the Long Strangle
Introduction to the Long Strangle
Talk about having your cake and eating it too! In the last chapter we discussed an options strategy that helps you prepare for volatility. Now what if we were to tell you that there are not just one but two such strategies you could choose from. ‘Two’ (pun intended) good to be true? You bet!
How do you construct a long strangle?
A long strangle is very similar to a long straddle. Both strategies are for when a trader believes that the underlying will be volatile. The difference is that a long strangle on a particular security will have a lower cost to purchase than a long straddle. However, the underlying will need to move more in order for a strangle to be profitable than for the straddle.
A long strangle consists of purchasing both a call and a put with the same expiration date but with different strike prices. The purchased call option will have a higher strike price than the purchased put option.
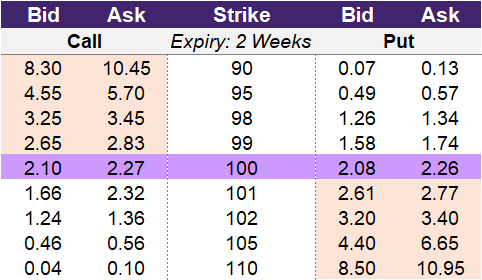
In the table below the underlying is trading at 100 and if a trader believes that this security will move significantly from 100 in the near future, then they could enter into a strangle.
You could select any strike but as an example you could purchase a call on the 102-strike which would cost you the asking price of 1.36. You could also purchase a corresponding put on the 98-strike which would cost you the asking price of 1.34. Entering into the 98-102 strangle would cost 2.70.
By comparison, to enter into a straddle with a strike of 100 – that is centred between 98 and 102 – would cost 4.53. This is because the 100 call costs 2.27 and the 100 put costs 2.26. As you can see the strangle is 40% (2.70 vs. 4.53) cheaper to enter than the straddle in this example.
Illustration 1
 Source: Upstox
Why would a trader use a long strangle?
A trader will enter into a strangle if they believe that the underlying will be volatile during the period before expiry. The trade works best when the underlying is less volatile before entering the trade and then becomes more volatile during the life of the options. The trader doesn’t have a specific forecast of bullish or bearish but will be successful if movement in the security occurs.
What is the max profit of a long strangle?
Key Formulae
- Long Strangle Max Profit (if the stock rises) = Unlimited – Total Premium Paid
- Long Strangle Max Profit (if the stock falls) = Strike Price – Total Premium Paid
The maximum gain and profit for strangles are similar to straddles and depend on the direction in which the underlying moves. If the underlying security moves upwards, then the payoff will be similar to a call option. If the underlying price closes up significantly at expiration, the call will be valuable but the put will be worthless. Conversely, if the underlying security moves downwards, then the payoff will mimic that of a put option.
With strangles, it may seem to be advantageous to pay a lower cost compared to straddles. The drawback is that the underlying will need to move even more to breakeven. However, if you believe that the underlying will be significantly more volatile in the near future, then a strangle could be a preferred choice instead of a straddle.
How much can you lose trading a long strangle?
Key Formula:
- Long Strangle Maximum Loss = Total Premium Paid
The maximum loss is capped at the price you paid to enter the strategy. Using the table above, if the trader entered into a strangle with strike prices of 95 and 105, the trader will pay 0.56 for the call option and 0.57 for the put option. This total cost of 1.13 is the maximum loss for this strategy.
What is the breakeven point when entering a long strangle?
Key Formula:
- Long Strangle Upper Breakeven Point = Strike Price + Total Premium Paid
- Long Strangle Lower Breakeven Point = Strike Price – Total Premium Paid
The breakeven point of a long strangle is the price of the underlying at which the trader can make a profit. There are two breakeven points for a strangle because the strategy involves the purchase of two options. To make a profit, the price of the underlying asset needs to move beyond the breakeven point in either direction. The upper breakeven point is the strike price plus the total premium paid to purchase the strangle. The lower breakeven point is the strike price minus the total premium paid to purchase the strangle.
A reminder about breakeven points is that these are for expiration. Because an option has time value remaining prior to expiry, the breakeven point of an option strategy will be less than on expiration. This is because a trader can exit the individual option contracts for a higher premium prior to expiration.
What is the profit formula for a long strangle?
Key Formula:
- Long Strangle Payoff = Max(0 Underlying Price – Strike Price) + Max(0 Strike Price – Underlying Price)
- Long Strangle Profit = Max(0 Underlying Price – Strike Price) + Max(0 Strike Price – Underlying Price) – Total Premium Paid
To calculate the profit of a long straddle, you combine the payoff formulas for a long call and a long put. The payoff formula for a long call is the maximum of 0 or the underlying price on expiry minus the strike price. The payoff formula for a long put is the maximum of 0 or the strike price minus the underlying price on expiry. The long strangle’s profit is calculated by taking the payoff of the long straddle and subtracting the total premium paid to enter into the long strangle.
What is the payoff diagram for a long strangle?
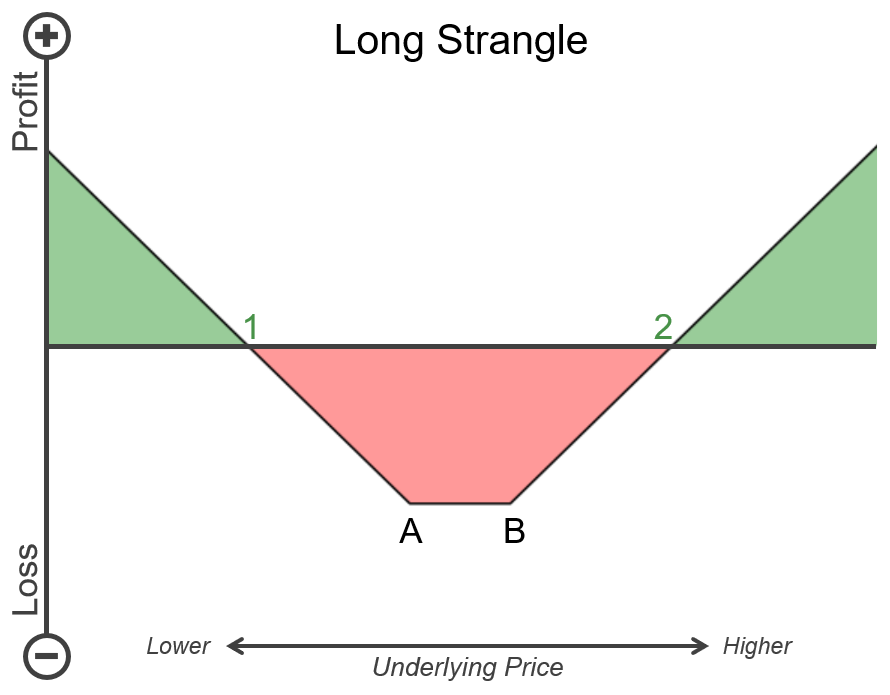
Below is an example P&L diagram for a long strangle. Points A and B on the chart are the strike prices selected for the long strangle. Point A is the put strike price, and Point B is the call strike price. Point 1 is the lower breakeven point, and Point 2 is the upper breakeven point. The vertical axis is the profit and loss, where the higher up values indicate more profit, and the lower values indicate a higher loss. The horizontal axis is the underlying price. Values to the right are a higher underlying price, and values to the left are a lower underlying price. Sections that are shaded green are when the long strangle will have a positive payoff, and sections that are in red are when the long strangle will have a negative payoff.
Illustration 2
 Source: Upstox
What is the point of max profit for a long strangle?
Key Formula:
- Price of Underlying = 0
or - Price of Underlying = ∞
A strangle lacks a defined point of maximum profitability as its maximum profit is uncapped. If the underlying asset continues to rise, the trader's earnings will also rise with the increasing value of the call option. Conversely, if the underlying asset continues to decline, the trader's earnings will rise as a result of the increasing value of the put option. In theory, the maximum profit for a strangle occurs when the underlying asset either rises to infinity or falls to zero.
What is the point of max loss for a long strangle?
Key Formula:
- Price of Underlying between the two Strike Prices
For a long strangle, maximum loss for a trader occurs if the underlying stays between the two strike prices selected. The max loss amount is the total premium paid to enter into the long strangle. If the underlying moves a little above the call strike price or a little below the put strike price, then there will be a positive payoff for one of the options. However, if the underlying doesn’t reach one of the two breakeven points, the trader will still suffer a loss but not the max loss.
What is the difference between buying a strangle and buying a straddle?
A strangle and a straddle are both options trading strategies where a trader can profit by the underlying significantly moving up or down in price. The main difference between them is the strike price of the options that are used. With a strangle, a trader buys out-of-the-money call and put options, whereas with a straddle, a trader buys call and put options on the same strike price.
A strangle will cost less to enter than a comparable straddle because the trader is buying options that are out-of-the-money. Even though a strangle costs less to enter than a straddle, there is a higher risk of not being profitable because the underlying needs to move beyond the strangle’s strike prices plus the cost to enter the strategy in order to breakeven.
Summary
- Use a long option strangle strategy if you believe the underlying will be volatile before expiry.
- This works best if volatility increases during the life of the options.
- Trader does not have a bullish or bearish outlook and benefits if any movement occurs in the security.
- On the same security, a long strangle will have a lower cost to purchase than a long straddle.
- The underlying will need to move more in order for a strangle to be profitable than for the straddle.
- To construct a long strangle, purchase both call and put options with the same expiry but different strike prices.
- Buy a call option at a higher strike price than the put option.
- Maximum gain and profit depend on the direction in which the underlying moves.
- If the underlying security moves up, then the payoff will be similar to a call option.
- If the underlying security moves down, then the payoff will be similar to a put option.
- If the underlying price doesn’t move enough to offset the cost of buying both options, you will incur a loss.
- Maximum loss is capped at the price you paid to enter the strategy.
- A long strangle has two breakeven points.
Is this chapter helpful?
- Home/
- Introduction to the Long Strangle