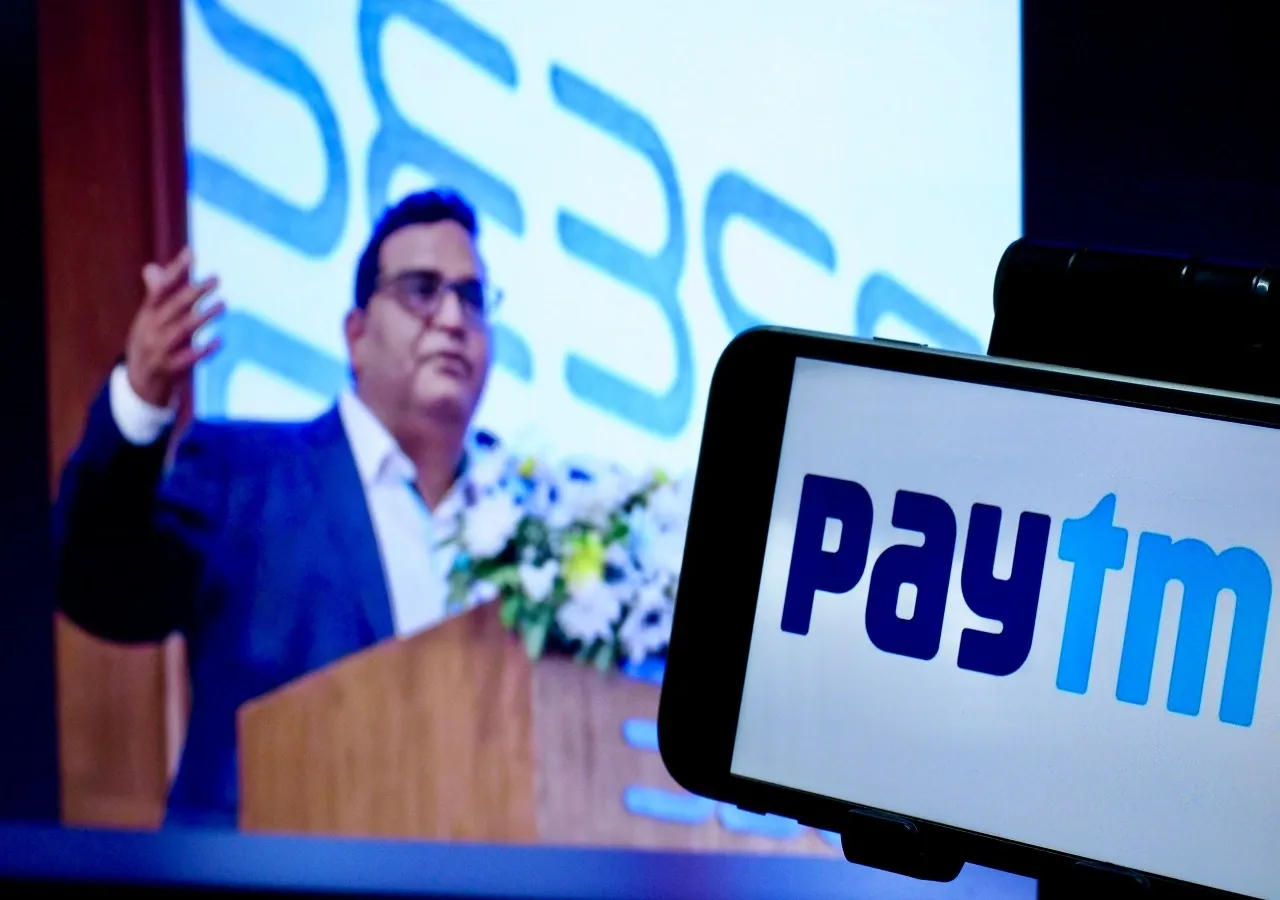
Paytm is a popular financial services and digital payments platform in India. Its parent One97 Communications Limited was founded in 2010 by Vijay Shekhar Sharma. The Noida-headquartered company deals in digital payments, payment gateways for businesses, online loans, stock trading platform and distribution of insurance.
It also provides services to merchants in accepting payments using QR codes. Paytm offers loans to small traders and businesses registered on its platform.
Paytm was listed on the stock exchanges in November 2021. Its market capitalisation stood at over ₹38,000 crore as of December 13, 2023. The Paytm share price has surged over 11% in the last year.
Sapphire Ventures (previously SAP Ventures) invested $10 million in One97 Communications Ltd in October 2011. Later, an Alibaba affiliate acquired a 40% stake in Paytm’s parent One97 Communications Limited. Paytm secured funding from Mountain Capital in August 2016. This increased the company's valuation to over $5 billion.
Paytm witnessed its largest single investor when SoftBank invested in it in May 2017. This increased the company's valuation to around $10 billion. Berkshire Hathaway also invested $356 million in Paytm in August 2018. The company raised $1 billion in a funding round led by US asset manager T Rowe Price in November 2019.
Paytm business operations
Paytm was initially offering mobile recharge and bill payment services on its platform. In 2013, the company added debit cards, postpaid mobile and landline bill payment services too. Paytm grew rapidly with the introduction of the Paytm wallet in 2014.
The company got a boost during demonetisation in 2016. Paytm's wallet service, approved by the Reserve Bank of India (RBI), allows users to store money digitally and make cashless transactions. In 2017, it became the first payments app in India to surpass 10 crore app downloads. Expanding its portfolio, Paytm later ventured into e-commerce, ticket booking, hotel reservations and many other services.
Paytm also collaborates with financial institutions to provide lending products such as personal loans and merchant loans. The Paytm app supports various payment methods for online and in-store transactions. These methods include Paytm's instruments and third-party options like cards and net banking.
Paytm is the third-largest player in the UPI payments sector after PhonePe and Google Pay. In FY2023, the company had an average of 32,798 on-roll and 1,589 off-roll employees.
Paytm had a total of 29 subsidiaries and 3 joint ventures as of March 31, 2023.
Paytm Financial Highlights
- Revenue: Paytm reported revenue of ₹9,291.00 crore in FY26 vs ₹7,625.00 crore in FY25. It showed an increase of 21.85% on a yearly basis.
- Operating Profit: Paytm reported an operating profit of ₹582.00 crore in FY26 vs ₹645.00 crore in FY25. It showed an increase of 190.23% on a year-on-year basis.
- Net Profit: Paytm reported a net profit of ₹552.00 crore in FY26 vs ₹663.00 crore in FY25. It showed an increase of 183.26% on a yearly basis.
Paytm Quarterly Result Highlights
- Paytm reported revenue of ₹2,630.00 crore in Jun 2026, compared with ₹2,442.00 crore in Mar 2026, representing an increase of 7.70% on a quarter-on-quarter (QoQ) basis.
- Paytm reported an operating profit of ₹247.00 crore in Jun 2026, compared with ₹194.00 crore in Mar 2026, representing an increase of 27.32% on a quarter-on-quarter (QoQ) basis.
- Paytm reported a profit of ₹220.00 crore in Jun 2026, compared with ₹183.00 crore in Mar 2026, reflecting an increase of 20.22% on a QoQ basis.
- The earnings per share (EPS) of Paytm stood at ₹10.35 during Jun 2026.