Tata Chemicals Returns Calculator
Note: Past profits do not guarantee future returns.
About Tata Chemicals
Tata Chemicals Limited (TCL) is the third-largest soda ash and the 6th largest sodium bicarbonate manufacturer globally. The company's history can be traced to Okhamandal Salt Works, set up in 1927. It became part of the Tata Group in 1939 after being overtaken by JRD Tata. Starting from industrial salt and soda ash, the company has diversified its product portfolio to various science-based products.
Tata Chemicals’ global footprint covers markets in Asia, North America, Europe and Africa. In 2008, the company through its wholly owned subsidiary Tata Chemicals Asia Pacific Pte Ltd entered into a joint venture with Singapore-based JOil (Singapore) Pte Ltd, a jatropha seeding company.
Business Operations
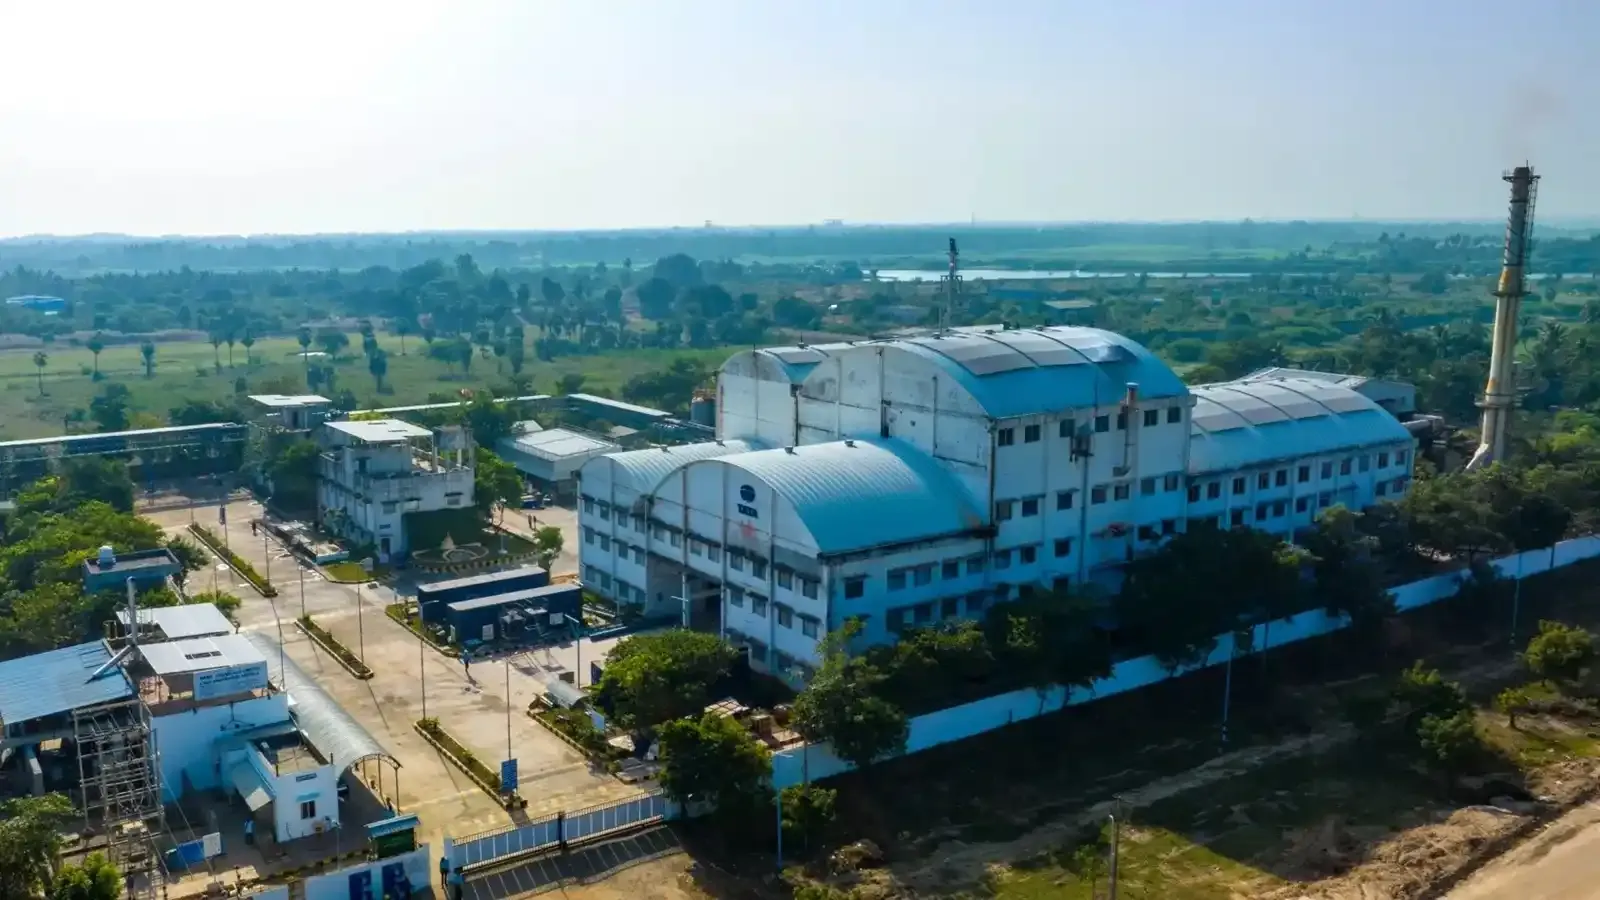
Tata Chemicals Limited operates in two verticals – basic chemistry and speciality chemical products. The company has its manufacturing facilities in India, the United Kingdom, Kenya and the United States.
The basic chemistry product range includes soda ash, sodium bicarbonate and other key chemical ingredients used to produce glass, detergent and other industrial products. Tata Chemicals is a market leader in the iodised salt segment and a leading manufacturer of urea and phosphatic fertilisers.
The speciality chemical product range covers four verticals – agri science, nutritional science, material science solution and energy science businesses.
Tata Chemicals’ agri science business is covered through a subsidiary – Rallis India – which has a presence in 80% of districts in India. Rallis India's portfolio has seven brands in crop protection and agri-input solutions.
The medical science solution business of the company includes products like Nano zinc oxide, highly dispersible silica and other grades of silica. The energy science business focuses on various domains of Lithium-ion technology – under the brand name InsperiCo.
Tata Chemicals' nutritional sciences vertical offers an innovative range of good-for-health nutritional solutions and prebiotics under the brand name Tata NQ.
The company;s consumer products include brands like Tata Salt and the dal brand Tata Sampann. The consumer products business was since demerged into Tata Consumer Products Limited in 2019.
As of December 18, 2023, Tata Chemicals Limited's market capitalisation stood at over ₹26, 323 crore. Tata Chemicals share price has surged over 111% in the last three years.
Tata Chemicals Innovation Centre has set up research and development (R&D) capabilities in the material sciences, nutritional sciences, nanotechnology, biotechnology and agriculture sciences.
Tata Chemicals Financial Highlights
- Revenue: Tata Chemicals reported revenue of ₹14,900.00 crore in FY26 vs ₹15,112.00 crore in FY25. It showed a decrease of 1.40% on a yearly basis.
- Operating Profit: Tata Chemicals reported an operating loss of ₹1,459.00 crore in FY26 vs ₹521.00 crore in FY25. It showed a decrease of 380.04% on a year-on-year basis.
- Net Profit: Tata Chemicals reported a net loss of ₹1,715.00 crore in FY26 vs ₹387.00 crore in FY25. It showed a decrease of 543.15% on a yearly basis.
Tata Chemicals Quarterly Result Highlights
- Tata Chemicals reported revenue of ₹4,311.00 crore in Jun 2026, compared with ₹3,482.00 crore in Mar 2026, representing an increase of 23.81% on a quarter-on-quarter (QoQ) basis.
- Tata Chemicals reported an operating profit of ₹110.00 crore in Jun 2026, compared with ₹1,982.00 crore in Mar 2026, representing an increase of 105.55% on a quarter-on-quarter (QoQ) basis.
- Tata Chemicals reported a profit of ₹60.00 crore in Jun 2026, compared with ₹2,116.00 crore in Mar 2026, reflecting an increase of 102.84% on a QoQ basis.
- The earnings per share (EPS) of Tata Chemicals stood at ₹74.42 during Jun 2026.
Data Source: BSE, Company announcements
Securities shown are illustrative, not recommendations. Past performance does not guarantee future results.
| Sep 2025 | 13.74% |
|---|---|
| Dec 2025 | 12.26% |
| Mar 2026 | 11.90% |
| Jun 2026 | 12.07% |
Tata Chemicals Shareholder Returns
Tata Chemicals Share Price History
| Name | Mkt Cap Cr | P/E | P/B | ROE | D/E | ROCE | Book Value | Div. Yield | Turnover | EPS(TTM) |
|---|---|---|---|---|---|---|---|---|---|---|
| Pidilite Industries | 1,59,410.00 | 59.57 | 14.72 | 22.61% | 0.03 | 29.97% | 104.78 | 0.73% | 0.98 | 23.43 |
| SRF | 75,914.40 | 35.12 | 5.41 | 13.07% | 0.27 | 13.18% | 426.52 | 0.35% | 0.65 | 58.18 |
| Linde India | 53,241.60 | 97.44 | 12.48 | 12.87% | 0.02 | 17.16% | 495.72 | 0.19% | 0.46 | 64.59 |
| Gujarat Fluorochemicals | 50,369.00 | 83.95 | 6.44 | 7.13% | 0.22 | 8.93% | 647.23 | 0.07% | 0.47 | 61.69 |
| Navin Fluorine | 44,051.50 | 55.78 | 11.08 | 16.69% | 0.03 | 18.14% | 714.37 | 0.10% | 0.56 | 96.03 |
| Godrej Industries | 37,304.60 | 16.88 | 3.34 | 11.10% | 6.25 | 9.34% | 52.52 | 0.00% | 0.36 | 1.81 |
| Himadri Speciality Chemicals | 34,020.90 | 42.30 | 7.23 | 15.96% | 0.16 | 19.45% | 91.62 | 0.12% | 0.75 | 15.05 |
| Deepak Nitrite | 21,931.30 | 27.99 | 3.76 | 9.43% | 0.02 | 10.74% | 235.74 | 0.47% | 0.74 | 13.85 |
| Aether Industries | 21,621.40 | 91.93 | 8.80 | 8.94% | 0.15 | 10.61% | 181.53 | 0.00% | 0.33 | 13.09 |
| Castrol India | 2,596.44 | 18.75 | 10.06 | 46.94% | 0.04 | 71.77% | 18.39 | 7.03% | 1.72 | 9.60 |
Auto-generated based on historical fundamentals; not a recommendation to buy/sell.
Tata Chemicals Financials
Income Statement · Consolidated
| Particulars | Mar 2026 | Mar 2025 | Mar 2024 | Mar 2023 |
|---|---|---|---|---|
| Revenue | ₹14,584.00 | ₹14,887.00 | ₹15,421.00 | ₹16,789.00 |
| Other Income | ₹316.00 | ₹225.00 | ₹286.00 | ₹218.00 |
| Total Revenue | ₹14,900.00 | ₹15,112.00 | ₹15,707.00 | ₹17,007.00 |
| Total Expenses | ₹14,570.00 | ₹14,620.00 | ₹14,084.00 | ₹14,265.00 |
| Profit Before Tax | -₹1,459.00 | ₹521.00 | ₹830.00 | ₹2,740.00 |
| Tax | ₹256.00 | ₹167.00 | ₹381.00 | ₹288.00 |
| Profit After Tax | -₹1,715.00 | ₹354.00 | ₹449.00 | ₹2,452.00 |
| EPS - Basic | -₹74.42 | ₹9.23 | ₹10.52 | ₹90.95 |
| EPS - Diluted | -₹74.42 | ₹9.23 | ₹10.52 | ₹90.95 |
Cash Flow · Consolidated
| Particulars | Mar 2026 | Mar 2025 | Mar 2024 | Mar 2023 |
|---|---|---|---|---|
| Profit before tax | -₹1,459.00 | ₹568.00 | ₹816.00 | ₹2,722.00 |
| Income before WC changes | ₹2,023.00 | ₹2,173.00 | ₹3,071.00 | ₹4,057.00 |
| Change in Assets | -₹706.00 | -₹126.00 | ₹788.00 | -₹746.00 |
| Change in Liabilities | -₹113.00 | -₹48.00 | -₹456.00 | ₹67.00 |
| Change in WC | -₹819.00 | -₹174.00 | ₹332.00 | -₹679.00 |
| Cash flow from Operations | ₹1,269.00 | ₹1,761.00 | ₹3,016.00 | ₹2,971.00 |
| Cash flow from Investing | -₹809.00 | -₹1,681.00 | -₹610.00 | -₹1,186.00 |
| Cash flow from Financing | -₹670.00 | ₹29.00 | -₹2,494.00 | -₹2,076.00 |
| Total Cash Flow | -₹210.00 | ₹109.00 | -₹88.00 | -₹291.00 |
| Cash (Start of the year) | ₹548.00 | ₹425.00 | ₹508.00 | ₹762.00 |
| Cash (End of the year) | ₹381.00 | ₹548.00 | ₹425.00 | ₹508.00 |
Balance Sheet · Consolidated
| Particulars | Mar 2026 | Mar 2025 | Mar 2024 | Mar 2023 |
|---|---|---|---|---|
| Non-Current Assets | ₹31,825.00 | ₹31,060.00 | ₹30,389.00 | ₹26,920.00 |
| Current Assets | ₹7,206.00 | ₹6,720.00 | ₹6,367.00 | ₹8,164.00 |
| Total Assets | ₹39,031.00 | ₹37,780.00 | ₹36,756.00 | ₹35,084.00 |
| Current Liabilities | ₹6,743.00 | ₹6,139.00 | ₹6,055.00 | ₹4,904.00 |
| Net Current Asset | ₹463.00 | ₹581.00 | ₹312.00 | ₹3,260.00 |
| Non-Current Liabilities | ₹10,113.00 | ₹9,140.00 | ₹7,587.00 | ₹9,538.00 |
| Equity Capital | ₹22,175.00 | ₹22,501.00 | ₹23,114.00 | ₹20,642.00 |
| Total Equity & Liabilities | ₹39,031.00 | ₹37,780.00 | ₹36,756.00 | ₹35,084.00 |
Income Statement · Standalone
| Particulars | Mar 2026 | Mar 2025 | Mar 2024 | Mar 2023 |
|---|---|---|---|---|
| Revenue | ₹4,831.00 | ₹4,441.00 | ₹4,384.00 | ₹4,930.00 |
| Other Income | ₹379.00 | ₹319.00 | ₹383.00 | ₹301.00 |
| Total Revenue | ₹5,210.00 | ₹4,760.00 | ₹4,767.00 | ₹5,231.00 |
| Total Expenses | ₹4,524.00 | ₹4,136.00 | ₹3,853.00 | ₹3,966.00 |
| Profit Before Tax | ₹672.00 | ₹624.00 | ₹1,016.00 | ₹1,265.00 |
| Tax | ₹66.00 | ₹100.00 | ₹120.00 | ₹238.00 |
| Profit After Tax | ₹606.00 | ₹524.00 | ₹896.00 | ₹1,027.00 |
| EPS - Basic | ₹23.79 | ₹21.87 | ₹35.17 | ₹40.31 |
| EPS - Diluted | ₹23.79 | ₹21.87 | ₹35.17 | ₹40.31 |
Cash Flow · Standalone
| Particulars | Mar 2026 | Mar 2025 | Mar 2024 | Mar 2023 |
|---|---|---|---|---|
| Profit before tax | ₹672.00 | ₹671.00 | ₹1,016.00 | ₹1,265.00 |
| Income before WC changes | ₹1,004.00 | ₹885.00 | ₹928.00 | ₹1,309.00 |
| Change in Assets | -₹145.00 | -₹147.00 | ₹217.00 | -₹284.00 |
| Change in Liabilities | ₹99.00 | ₹199.00 | -₹189.00 | ₹141.00 |
| Change in WC | -₹46.00 | ₹52.00 | ₹28.00 | -₹143.00 |
| Cash flow from Operations | ₹1,119.00 | ₹803.00 | ₹806.00 | ₹885.00 |
| Cash flow from Investing | -₹1,917.00 | -₹2,493.00 | -₹351.00 | -₹558.00 |
| Cash flow from Financing | ₹768.00 | ₹1,710.00 | -₹458.00 | -₹332.00 |
| Total Cash Flow | -₹30.00 | ₹20.00 | -₹3.00 | -₹5.00 |
| Cash (Start of the year) | ₹30.00 | ₹10.00 | ₹13.00 | ₹18.00 |
| Cash (End of the year) | ₹0.00 | ₹30.00 | ₹10.00 | ₹13.00 |
Balance Sheet · Standalone
| Particulars | Mar 2026 | Mar 2025 | Mar 2024 | Mar 2023 |
|---|---|---|---|---|
| Non-Current Assets | ₹23,454.00 | ₹20,778.00 | ₹19,047.00 | ₹14,906.00 |
| Current Assets | ₹1,851.00 | ₹1,933.00 | ₹1,740.00 | ₹2,982.00 |
| Total Assets | ₹25,305.00 | ₹22,711.00 | ₹20,787.00 | ₹17,888.00 |
| Current Liabilities | ₹1,370.00 | ₹1,684.00 | ₹1,072.00 | ₹1,353.00 |
| Net Current Asset | ₹481.00 | ₹249.00 | ₹668.00 | ₹1,629.00 |
| Non-Current Liabilities | ₹4,627.00 | ₹2,833.00 | ₹990.00 | ₹543.00 |
| Equity Capital | ₹19,308.00 | ₹18,194.00 | ₹18,725.00 | ₹15,992.00 |
| Total Equity & Liabilities | ₹25,305.00 | ₹22,711.00 | ₹20,787.00 | ₹17,888.00 |
| 18 Sep | 1Cr |
|---|---|
| 17 Sep | 1Cr |
| 16 Sep | 2Cr |
| 15 Sep | 18L |
| Average | 1Cr |
Technical indicators used here are for indicative purposes only. Kindly do not treat it as an investment or trading advice
Popular Stocks
Tata Chemicals Share Price FAQs
Tata Chemicals share price data is sourced from NSE/BSE and may be delayed. It is displayed for informational purposes only and does not constitute investment advice or a recommendation to buy or sell.
Trusted by 2 Crore+ Indians for their wealth-building needs. SEBI Registered Broker. SEBI Reg No. INZ000315837