As of 11 Jul 2026, JSW Steel share price is ₹1,245.40. The stock opened at ₹1,232.30, compared to its previous close of ₹1,225.80. During today's trading session, JSW Steel share price moved in the range of ₹1,232.30 to ₹1,259.00, with an average price of ₹1,245.65 for the day. Looking at its last 52-week, the stock has touched a low of ₹1,017.40 and a high of ₹1,328.00. On the performance front, JSW Steel share price has increased by 7.47% over the last six months and is up 19.37% on a year-on-year basis.
| Name | Mkt Cap Cr | P/E | P/B | ROE | D/E | ROCE | Book Value | Div. Yield | Turnover | EPS(TTM) |
|---|---|---|---|---|---|---|---|---|---|---|
| Tata Steel | 2,34,441.00 | 22.17 | 2.38 | 11.44% | 0.40 | 11.37% | 1.39 | 2.09% | 0.66 | 12.87 |
| Jindal Steel & Power | 1,05,115.00 | 31.27 | 2.07 | 7.92% | 0.16 | 9.16% | 520.84 | 0.19% | 0.96 | 30.23 |
| SAIL | 68,504.80 | 20.57 | 1.15 | 6.35% | 0.55 | 7.76% | 140.89 | 1.40% | 1.24 | 7.83 |
| Jindal Stainless | 59,020.20 | 18.35 | 2.95 | 16.14% | 0.24 | 17.44% | 228.86 | 0.56% | 1.86 | 34.51 |
| Shyam Metalics and Energy | 26,400.30 | 24.90 | 2.29 | 9.29% | 0.05 | 13.08% | 230.62 | 0.28% | 1.06 | 19.87 |
| Sarda Energy & Minerals | 17,677.20 | 15.73 | 2.37 | 15.00% | 0.21 | 16.80% | 190.51 | 0.40% | 0.51 | 26.92 |
| GODAWARI POW & ISP LTD | 16,854.40 | 21.36 | 2.99 | 13.79% | 0.08 | 18.50% | 83.14 | 0.38% | 0.76 | 14.20 |
| Gallantt Ispat | 16,121.20 | 33.29 | 4.86 | 14.60% | 0.17 | 16.69% | 137.44 | 0.30% | 1.23 | 20.07 |
| Usha Martin | 15,295.00 | 32.80 | 4.63 | 14.11% | 0.00 | 17.96% | 58.70 | 0.75% | 1.24 | 12.42 |
| VEDANTA IRON AND STEEL L | 13,561.20 | 0.00 | 34.69 | 49.39% | -0.84 | 252.94% | 1.00 | 0.00% | 0.00 | 3.66 |
| Particulars | Mar 2026 | Mar 2025 | Mar 2024 | Mar 2023 |
|---|---|---|---|---|
| Revenue | ₹185,470.00 | ₹168,824.00 | ₹175,006.00 | ₹165,960.00 |
| Other Income | ₹1,248.00 | ₹694.00 | ₹1,004.00 | ₹1,030.00 |
| Total Revenue | ₹186,718.00 | ₹169,518.00 | ₹176,010.00 | ₹166,990.00 |
| Total Expenses | ₹174,352.00 | ₹163,641.00 | ₹163,047.00 | ₹161,789.00 |
| Profit Before Tax | ₹29,250.00 | ₹5,077.00 | ₹13,380.00 | ₹5,655.00 |
| Tax | ₹3,742.00 | ₹1,586.00 | ₹4,407.00 | ₹1,516.00 |
| Profit After Tax | ₹25,508.00 | ₹3,491.00 | ₹8,973.00 | ₹4,139.00 |
| EPS - Basic | ₹91.43 | ₹14.36 | ₹36.34 | ₹17.25 |
| EPS - Diluted | ₹91.25 | ₹14.32 | ₹36.17 | ₹17.14 |
| Particulars | Mar 2026 | Mar 2025 | Mar 2024 | Mar 2023 |
|---|---|---|---|---|
| Profit before tax | ₹29,250.00 | ₹5,077.00 | ₹13,380.00 | ₹5,655.00 |
| Income before WC changes | ₹32,085.00 | ₹23,553.00 | ₹28,472.00 | ₹20,856.00 |
| Change in Assets | -₹9,200.00 | ₹514.00 | -₹6,549.00 | -₹1,791.00 |
| Change in Liabilities | ₹5,492.00 | -₹1,195.00 | -₹7,066.00 | ₹4,896.00 |
| Change in WC | -₹3,708.00 | -₹681.00 | -₹13,615.00 | ₹3,105.00 |
| Cash flow from Operations | ₹25,152.00 | ₹20,899.00 | ₹12,078.00 | ₹23,323.00 |
| Cash flow from Investing | ₹18,690.00 | -₹16,997.00 | -₹14,638.00 | -₹10,711.00 |
| Cash flow from Financing | -₹16,111.00 | -₹262.00 | -₹5,005.00 | -₹5,977.00 |
| Total Cash Flow | ₹27,731.00 | ₹3,640.00 | -₹7,565.00 | ₹6,635.00 |
| Cash (Start of the year) | ₹11,655.00 | ₹8,030.00 | ₹15,424.00 | ₹8,808.00 |
| Cash (End of the year) | ₹39,256.00 | ₹11,655.00 | ₹8,030.00 | ₹15,424.00 |
| Particulars | Mar 2026 | Mar 2025 | Mar 2024 | Mar 2023 |
|---|---|---|---|---|
| Non-Current Assets | ₹166,241.00 | ₹170,006.00 | ₹163,664.00 | ₹142,928.00 |
| Current Assets | ₹103,435.00 | ₹70,736.00 | ₹64,534.00 | ₹68,150.00 |
| Total Assets | ₹269,676.00 | ₹240,742.00 | ₹228,198.00 | ₹211,078.00 |
| Current Liabilities | ₹69,377.00 | ₹60,626.00 | ₹66,065.00 | ₹69,963.00 |
| Net Current Asset | ₹34,058.00 | ₹10,110.00 | -₹1,531.00 | -₹1,813.00 |
| Non-Current Liabilities | ₹94,824.00 | ₹98,450.00 | ₹82,357.00 | ₹74,076.00 |
| Equity Capital | ₹105,475.00 | ₹81,666.00 | ₹79,776.00 | ₹67,039.00 |
| Total Equity & Liabilities | ₹269,676.00 | ₹240,742.00 | ₹228,198.00 | ₹211,078.00 |
| Particulars | Mar 2026 | Mar 2025 | Mar 2024 | Mar 2023 |
|---|---|---|---|---|
| Revenue | ₹132,847.00 | ₹127,702.00 | ₹135,180.00 | ₹131,687.00 |
| Other Income | ₹1,730.00 | ₹1,865.00 | ₹1,704.00 | ₹1,572.00 |
| Total Revenue | ₹134,577.00 | ₹129,567.00 | ₹136,884.00 | ₹133,259.00 |
| Total Expenses | ₹125,293.00 | ₹121,720.00 | ₹124,743.00 | ₹126,291.00 |
| Profit Before Tax | ₹8,807.00 | ₹6,543.00 | ₹12,102.00 | ₹6,968.00 |
| Tax | ₹2,285.00 | ₹706.00 | ₹4,061.00 | ₹2,031.00 |
| Profit After Tax | ₹6,522.00 | ₹5,837.00 | ₹8,041.00 | ₹4,937.00 |
| EPS - Basic | ₹26.72 | ₹23.94 | ₹33.16 | ₹20.55 |
| EPS - Diluted | ₹26.67 | ₹23.87 | ₹33.01 | ₹20.42 |
| Particulars | Mar 2026 | Mar 2025 | Mar 2024 | Mar 2023 |
|---|---|---|---|---|
| Profit before tax | ₹8,807.00 | ₹6,543.00 | ₹12,102.00 | ₹6,968.00 |
| Income before WC changes | ₹22,121.00 | ₹18,790.00 | ₹21,945.00 | ₹17,364.00 |
| Change in Assets | -₹6,162.00 | ₹2,997.00 | -₹7,660.00 | -₹487.00 |
| Change in Liabilities | ₹1,352.00 | -₹3,195.00 | -₹6,393.00 | ₹4,033.00 |
| Change in WC | -₹4,810.00 | -₹198.00 | -₹14,053.00 | ₹3,546.00 |
| Cash flow from Operations | ₹15,143.00 | ₹16,891.00 | ₹5,449.00 | ₹20,444.00 |
| Cash flow from Investing | -₹8,786.00 | -₹9,979.00 | -₹8,729.00 | -₹7,361.00 |
| Cash flow from Financing | -₹9,286.00 | -₹2,270.00 | -₹5,477.00 | -₹7,085.00 |
| Total Cash Flow | -₹2,929.00 | ₹4,642.00 | -₹8,757.00 | ₹5,998.00 |
| Cash (Start of the year) | ₹9,595.00 | ₹4,953.00 | ₹13,668.00 | ₹7,670.00 |
| Cash (End of the year) | ₹6,666.00 | ₹9,595.00 | ₹4,953.00 | ₹13,668.00 |
| Particulars | Mar 2026 | Mar 2025 | Mar 2024 | Mar 2023 |
|---|---|---|---|---|
| Non-Current Assets | ₹156,293.00 | ₹145,917.00 | ₹142,344.00 | ₹123,697.00 |
| Current Assets | ₹46,918.00 | ₹46,344.00 | ₹43,094.00 | ₹49,144.00 |
| Total Assets | ₹203,211.00 | ₹192,261.00 | ₹185,438.00 | ₹172,841.00 |
| Current Liabilities | ₹44,911.00 | ₹43,608.00 | ₹49,454.00 | ₹49,335.00 |
| Net Current Asset | ₹2,007.00 | ₹2,736.00 | -₹6,360.00 | -₹191.00 |
| Non-Current Liabilities | ₹72,640.00 | ₹68,814.00 | ₹60,701.00 | ₹59,847.00 |
| Equity Capital | ₹85,660.00 | ₹79,839.00 | ₹75,283.00 | ₹63,659.00 |
| Total Equity & Liabilities | ₹203,211.00 | ₹192,261.00 | ₹185,438.00 | ₹172,841.00 |
Established in: 1982
Managing Director: Sajjan Jindal
JSW Steel Limited is a multinational steel producer headquartered in Mumbai, Maharashtra. The company is a flagship of the JSW Group and is a result of a merger of Bhusan Power & Steel, Ispat Steel and Jindal Vijayanar Steel Limited. The company was incorporated in 1982 and has become one of India’s major private sector steel companies.
The company launched their IPO in the 1990s and listed on India stock exchanges, BSE and NSE. JSW Steel Limited is a constituent of the Nifty 50 index.
JSW Steel was established in 192 when the Jindal Group acquired Piramal Steel Limited, which was a mini steel mill in Tarapur, Maharashtra. The Piramal Steel Limited was renamed as Jindal Iron and Steel Company (JISCO). JISCO, now known as JSW Steel Limited, set up its first steel plant in Vasind, Maharashtra.
In the following years, Jindal Vijaynagr Steel Limited (JVSL) set up its plant in Toranagallu, Karnataka, which offered good connectivity to Mormugao Port and Mangalore Port. The plant is considered the sixth-largest steel plant in the world. In 2005, JISCO and JVSL merged to form JSW Steel Limited.
The following are the business segments of JSW Steel Limited.
Operations The steel producing segments of the company are the core revenue driver and involve manufacturing, sale and distribution of a variety of iron and steel products. The company uses the captive power generation and distribution facilities to power its steel manufacturing plants that require high power.
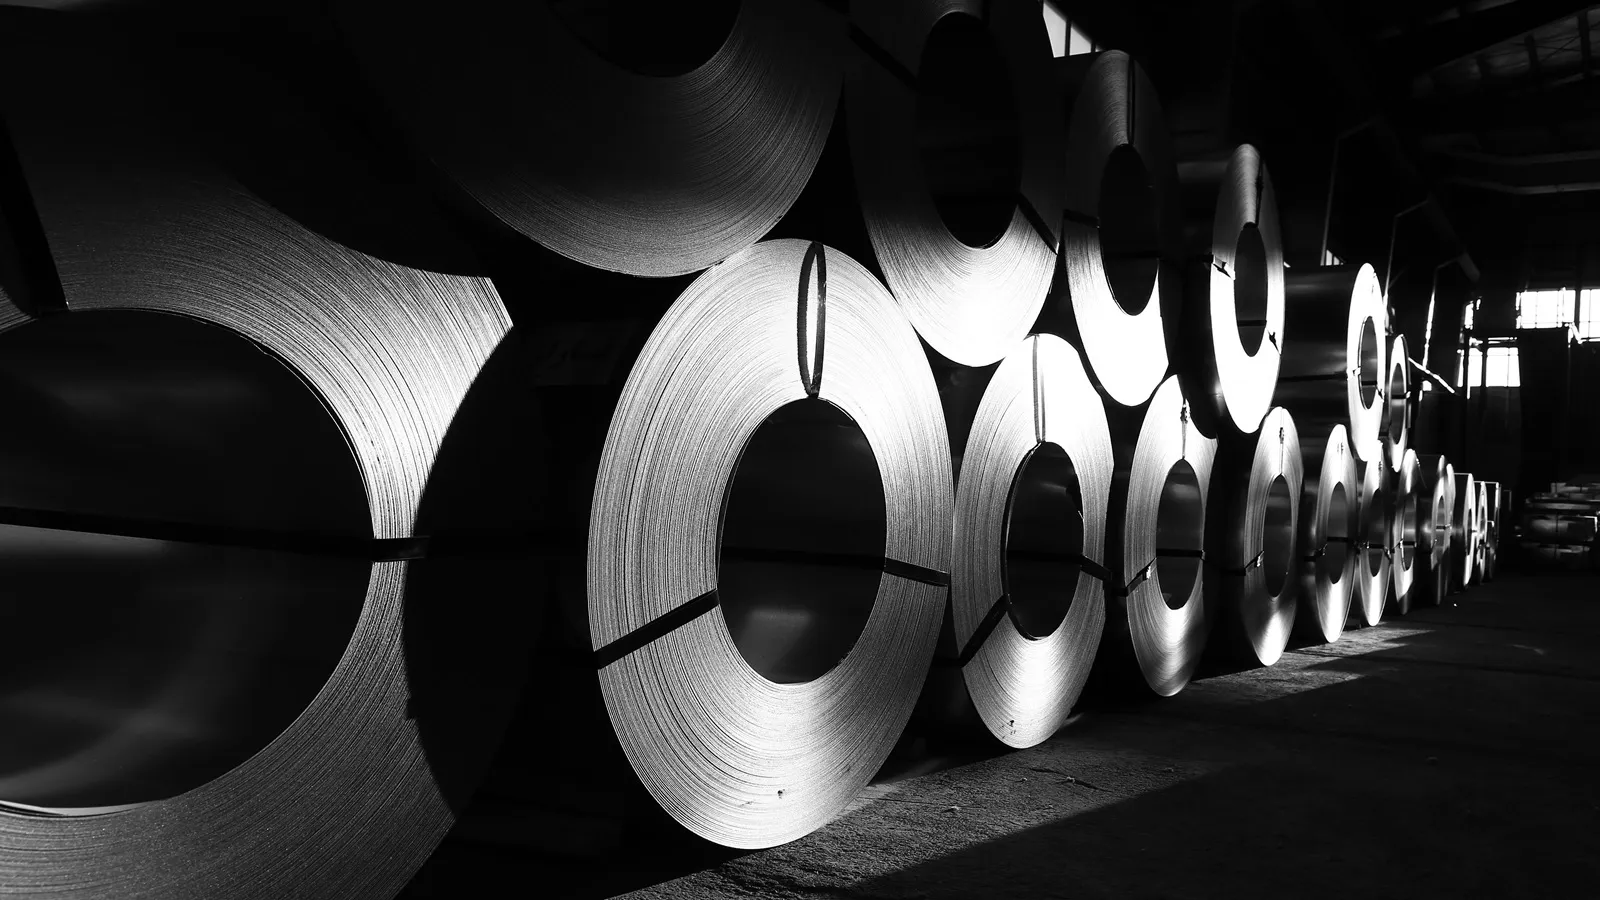
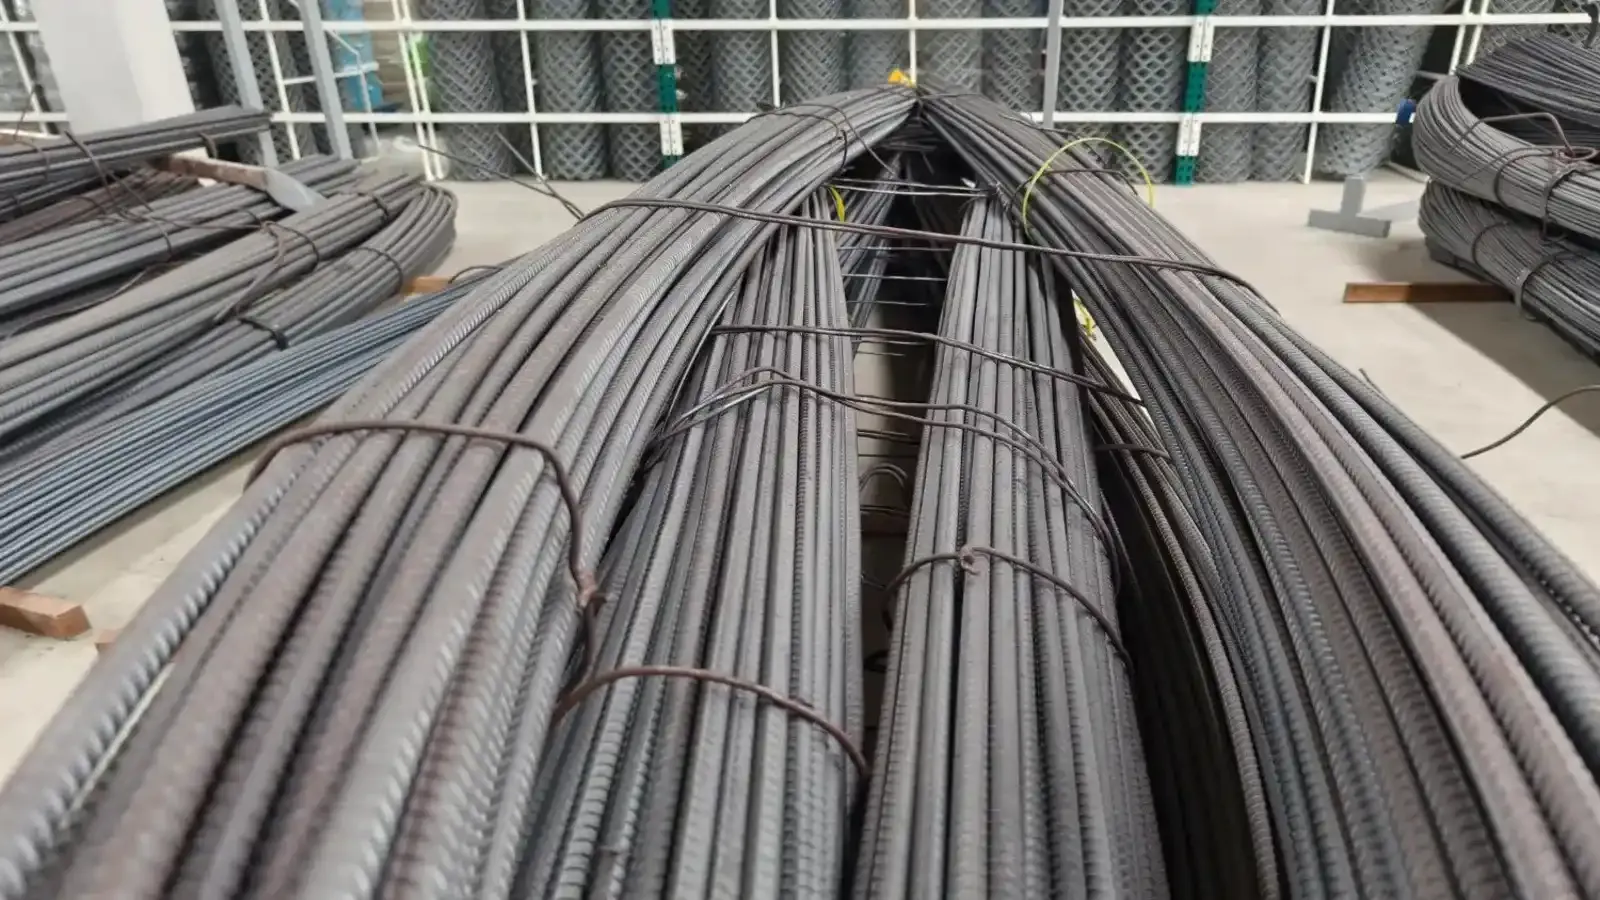
Steel Product The company produces Hot Rolled (HR) coils, sheets and plates, Cold Rolled (CR) coils, tinplates and galvanised steel. These are used in automotive, construction and consumer appliances. JSW Steel Limited also manufactures Thermo-Mechanically Treated (TMT) bars, wire rods, special steel bars, rails and grinding balls used in infrastructure and construction sectors.

Customer End-Use Segments The steel products are distributed to various national and international industrial sectors such as automotive, infrastructure, construction, renewable energy, consumer appliances and engineering.
The following are the Indian and International subsidiaries of JSW Steel Limited.
The following are the future plans of JSW Steel Limited.
JSW Utkal Steel Ltd is constructing a new 5 MTPA greenfield plant with commission targeted by FY2030.
Strategic Partnerships JSW Steel Limited and POSCO entered into a strategic joint venture to establish a 6 MPTA integrated steel plant in India. The company is also actively securing the upstream supply chain and has acquired coking coal mines in Mozambique.
ESG Goals The company has invested around ₹20 billion towards producing high-tensile steel, packaging steel and electrical steel used in EV and energy transition sectors. JSW Steel Limited is also investing significantly in green steel initiatives and targeting carbon neutrality for direct emissions by 2050.
JSW Steel share price is ₹1,245.40 as on 10 Jul, 2026, 15:47 IST.
In the last 1 year, JSW Steel delivered a return of 19.37%. The JSW Steel share price hit a high of ₹1,328.00 and low of ₹1,017.40.
The Mutual Fund Shareholding in JSW Steel was 5.33% at the end of Mar 2026.
The 52-week high and low of JSW Steel share is ₹1,328.00 and ₹1,017.40 as of 10 Jul, 2026.
The market capitalisation of JSW Steel is ₹2,99,421.00 Crores as on 10 Jul, 2026.
The stock symbol of JSW Steel is JSWSTEEL on the NSE, 500228 on the BSE, and the ISIN is INE019A01038.
JSW Steel shares closed yesterday at ₹1,225.80 on NSE & ₹1,224.40 on BSE
To buy JSW Steel shares, open a demat account with Upstox and complete the KYC process. Once your account is set up, search for the stock and place your order.
No, shares of JSW Steel or any other publicly traded company cannot be bought or sold on holidays when the stock exchanges are closed. You can only buy or sell JSW Steel shares on days when the stock exchanges are open for trading. It's important to check the NSE & BSE holidays calendar, before placing any trades to avoid any inconvenience.
The PE and PB ratio of JSW Steel is 15.34 and 3.42 respectively, as on 10 Jul, 2026, 15:47 IST.