Logo

Adani Power Share Price

₹ 221.79
-₹2.76 (-1.23%)
1D
Last updated 03 Jul, 2026, 15:59 IST

Adani Power Share Price Today

As of 4 Jul 2026, Adani Power share price is ₹221.79. The stock opened at ₹225.75, compared to its previous close of ₹224.55. During today's trading session, Adani Power share price moved in the range of ₹219.55 to ₹226.32, with an average price of ₹222.94 for the day. Looking at its last 52-week, the stock has touched a low of ₹110.45 and a high of ₹254.20.


₹219.55
1.23% down today
₹226.32
1D LOW
1D HIGH

Adani Power Returns Calculator

Open
₹225.75
High
₹226.32
Low
₹219.55
Prev. close
₹224.55

Circuit
L
H
₹199.62
₹243.96
52-week
L
H
₹110.45
₹254.20

Adani Power Shareholder Returns

Adani Power Share Price History

Mkt Cap Cr
4,33,134.00

P/E
22.60

P/B
4.68

ROE
21.39%

D/E
0.85

ROCE
16.60%

Div. Yield
0.00%

EPS(TTM)
5.67
Turnover
0.43

EV/EBITDA
14.42

Net Margin
24.26%

Op. Margin
47.37%

ROA
10.11%

Quick Ratio
1.52

Curr. Ratio
1.16
Based on fundamentals, this stock's
Step 1 of 5
Performance
Very Poor
Adani Power has not beaten FD return of 7%
Step 3 of 5
Valuation
Fairly Valued
Adani Power appears to be fairly valued compared to its peers
Step 4 of 5
Earnings
Good
Adani Power revenue, operating profit and net profit are growing
Peer Comparison
Peer comparison — key ratios
NameMkt Cap CrP/EP/BROED/EROCEBook ValueDiv. YieldTurnoverEPS(TTM)
NTPC3,47,480.0012.611.7113.31%1.098.02%180.342.51%0.5123.89
Power Grid Corp2,68,043.0016.822.6715.85%1.488.81%107.444.68%0.1717.12
Adani Green2,56,185.0080.446.8913.72%1.857.96%8.920.00%0.593.59
Adani Energy Solution1,86,980.0049.174.4910.08%0.469.53%5.370.00%0.114.75
SIEMENS ENERGY INDIA LTD1,26,384.0093.8125.2925.11%0.0331.50%123.030.13%0.8630.89
Tata Power1,20,241.0032.283.1213.59%1.269.58%6.820.66%0.323.52
JSW Energy1,03,674.0037.052.769.51%0.538.34%3.510.42%0.094.92
NHPC80,952.9019.191.959.09%1.115.23%39.792.00%0.123.60
NTPC GREEN ENERGY LIMITED81,280.40155.584.292.76%0.482.95%22.420.00%0.060.48
Torrent Power70,219.0028.443.6812.67%0.4412.11%378.401.44%0.7451.10

Adani Power Financials

Full statement

Income Statement · Consolidated

Income Statement · Consolidated — all values in INR Crore
ParticularsMar 2026Mar 2025Mar 2024Mar 2023
Revenue₹54,240.52₹56,203.09₹50,351.25₹38,773.30
Other Income₹3,624.76₹2,702.74₹9,930.23₹4,267.22
Total Revenue₹57,865.28₹58,905.83₹60,281.48₹43,040.52
Total Expenses₹42,365.77₹42,546.32₹39,489.97₹35,365.82
Profit Before Tax₹15,499.51₹16,359.51₹20,791.51₹7,674.70
Tax₹2,528.43₹3,609.90-₹37.28-₹3,051.94
Profit After Tax₹12,971.08₹12,749.61₹20,828.79₹10,726.64
EPS - Basic₹6.62₹6.46₹51.62₹24.57
EPS - Diluted₹6.62₹6.46₹51.62₹24.57

Cash Flow · Consolidated

Cash Flow · Consolidated — all values in INR Crore
ParticularsMar 2026Mar 2025Mar 2024Mar 2023
Profit before tax₹15,499.51₹16,359.51₹20,791.51₹7,674.70
Income before WC changes₹20,858.50₹21,949.55₹18,677.65₹9,859.78
Change in Assets-₹220.29₹1,017.95-₹2,925.84-₹4,108.62
Change in Liabilities-₹226.82-₹1,458.05-₹1,524.24₹2,758.02
Change in WC-₹447.11-₹440.10-₹4,450.08-₹1,350.60
Cash flow from Operations₹20,513.65₹21,501.11₹14,170.15₹8,430.53
Cash flow from Investing-₹26,460.56-₹17,142.05₹3,482.32₹1,544.43
Cash flow from Financing₹6,554.93-₹5,175.45-₹16,864.03-₹10,408.46
Total Cash Flow₹608.02-₹816.39₹788.44-₹433.50
Cash (Start of the year)₹319.86₹1,136.25₹349.23₹782.37
Cash (End of the year)₹927.88₹319.86₹1,136.25₹349.23

Balance Sheet · Consolidated

Balance Sheet · Consolidated — all values in INR Crore
ParticularsMar 2026Mar 2025Mar 2024Mar 2023
Non-Current Assets₹113,591.84₹86,604.12₹66,738.19₹66,268.27
Current Assets₹28,688.08₹26,313.45₹25,586.58₹19,553.00
Total Assets₹142,279.92₹112,917.57₹92,324.77₹85,821.27
Current Liabilities₹20,328.21₹16,440.99₹15,788.67₹17,744.59
Net Current Asset₹8,359.87₹9,872.46₹9,797.91₹1,808.41
Non-Current Liabilities₹55,549.79₹38,803.02₹33,391.07₹38,201.02
Equity Capital₹66,401.92₹57,673.56₹43,145.03₹29,875.66
Total Equity & Liabilities₹142,279.92₹112,917.57₹92,324.77₹85,821.27

Income Statement · Standalone

Income Statement · Standalone — all values in INR Crore
ParticularsMar 2026Mar 2025Mar 2024Mar 2023
Revenue₹45,288.78₹49,710.76₹46,456.50₹36,681.21
Other Income₹4,271.70₹2,860.35₹10,089.28₹4,519.98
Total Revenue₹49,560.48₹52,571.11₹56,545.78₹41,201.19
Total Expenses₹35,254.01₹37,287.42₹36,965.11₹33,811.81
Profit Before Tax₹14,306.47₹15,283.69₹19,580.67₹7,389.38
Tax₹3,318.80₹3,723.84-₹51.28-₹2,856.77
Profit After Tax₹10,987.67₹11,559.85₹19,631.95₹10,246.15
EPS - Basic₹5.67₹5.75₹48.53₹23.32
EPS - Diluted₹5.67₹5.75₹48.53₹23.32

Cash Flow · Standalone

Cash Flow · Standalone — all values in INR Crore
ParticularsMar 2026Mar 2025Mar 2024Mar 2023
Profit before tax₹14,306.47₹15,283.69₹19,580.67₹7,389.38
Income before WC changes₹18,170.72₹20,104.45₹17,200.94₹8,981.96
Change in Assets₹1,469.71₹439.68-₹2,672.51-₹3,136.54
Change in Liabilities-₹621.21-₹2,086.15-₹1,501.45₹2,162.71
Change in WC₹848.50-₹1,646.47-₹4,173.96-₹973.83
Cash flow from Operations₹19,148.32₹18,453.23₹12,975.78₹7,933.07
Cash flow from Investing-₹23,363.83-₹10,810.61₹3,144.04₹2,823.99
Cash flow from Financing₹4,829.56-₹8,041.08-₹15,751.44-₹11,137.82
Total Cash Flow₹614.05-₹398.46₹368.38-₹380.76
Cash (Start of the year)₹169.36₹567.82₹198.02₹574.52
Cash (End of the year)₹783.41₹169.36₹567.82₹193.76

Balance Sheet · Standalone

Balance Sheet · Standalone — all values in INR Crore
ParticularsMar 2026Mar 2025Mar 2024Mar 2023
Non-Current Assets₹95,322.99₹73,946.11₹64,816.82₹55,633.82
Current Assets₹24,224.83₹22,737.04₹24,180.22₹17,198.13
Total Assets₹119,547.82₹96,683.15₹88,997.04₹72,831.95
Current Liabilities₹14,056.42₹14,982.84₹15,789.20₹14,924.01
Net Current Asset₹10,168.41₹7,754.20₹8,391.02₹2,274.12
Non-Current Liabilities₹52,476.87₹35,251.35₹32,991.62₹29,684.07
Equity Capital₹53,014.53₹46,448.96₹40,216.22₹28,223.87
Total Equity & Liabilities₹119,547.82₹96,683.15₹88,997.04₹72,831.95
* All values are in INR Crore
Qty
Bid
0
0
0
0
0
0
0
0
0
0
Ask
Qty
221.79
168
0
0
0
0
0
0
0
0
Bid Total: 0
Ask Total: 168
Buy orders: 0%
Sell orders: 100%
Bearish
1
Neutral
3
Bullish
4
Slightly Bullish
by SEBI experts
Expert Pick
EXPPICK
Stop-loss
Entry price
Target
Indicator
Value
Verdict

RSI (14)
46.09
Neutral

ATR (14)
6.34
Neutral

STOCH(9,6)
14.04
Bullish

STOCH RSI (14)
0
Bullish

ADX(9)
16.9
Bullish

UO(9)
40.28
Neutral

ROC(12)
-0.36
Bearish

WillR(14)
-81.17
Bullish
Period
Simple value
Exponential vaue

5D
224.8
224.74

10D
228
225.96

20D
225.89
226.25

50D
225.49
217.47

100D
190.13
200.15

About Adani Power

Adani Power logo
ISIN
INE814H01029
Sector Market Cap
₹ 4,33,134 Cr

Adani Power Limited is the leading name in India’s power generation sector and the largest private thermal power producer. Backed by the Adani Group, the company focuses on delivering affordable electricity to millions of people.

Adani Power operates a diversified portfolio of coal-based power plants with a strong focus on efficiency, sustainability and scale. The company has an installed thermal power capacity of 18,110 MW spread across 12 power plants in Gujarat, Maharashtra, Karnataka, Rajasthan and other states.

Adani Power plays a critical role in fulfilling the growing energy demand while aligning with national priorities for infrastructure development and energy security.

History of Adani Power Limited

Adani Power Limited was established in 1996, with the objective of strengthening India’s power generation infrastructure. The company hits a major milestone with the development of the Mundra power plant in Gujarat. This project has emerged as one of the largest thermal power projects in the world.

Over time, Adani Power expanded its presence across several Indian states through new projects and strategic acquisitions. By reviving the stressed power assets company improved its operational performance and slowly increased its power generation capacity. Today, Adani Power stands as an important contributor to India’s evolving energy landscape.

Adani Power Business Segments

Below are the business segments of Adani Power Limited.

1. Thermal Power Generation: Adani Power’s main business is electricity generation through large-scale coal-based power plants. The plants are spread across key states in India, which helps in efficient distribution.

2. Power Supply to Utilities and DISCOMs: The company supplies electricity under long-term power purchase agreements with electricity boards and distribution companies. It ensures stable and predictable revenue.

3. Merchant Power Sales: A small portion of power generation capacity is sold on a merchant basis in the open market. It allows companies to benefit from higher spot power prices during high-demand periods.

4. Integrated Fuel Management: Adani Power leverages backward integration by sourcing coal efficiently through domestic linkage and imports. This is possible with the support of Adani Group’s logistics and port infrastructure.

5. Operations and Maintenance: The company focuses on efficient power plant operations, cost control, and high plant availability, which helps to improve margins.

Adani Power Limited R&D

APTRI research and development centre, which focuses on technical and policy-relevant studies of all aspects of energy and power.

The centre aims to contribute towards filling the technology gap across various segments of power and achieving sustainability. Its motive is to improve the design of the individual plant component or evolve a cost-efficient process.

R&D Projects take advantage of Renewable Energy Technologies and take up hybrid projects capable of delivering higher efficiency of operation and integration.

Adani Power Financial Performance (FY25 vs FY24)

Revenue: Adani Power reported a consolidated revenue of ₹58,905.83 crore in FY25 vs ₹60,281.48 crore in FY24. It showed a decrease of -2.28% on a yearly basis, reflecting slightly negative performance.

Operating Profit: The company reported an operating profit of ₹16,359.51 crore in FY25 vs ₹20,791.51 crore in FY24. It showed a decrease of -21.31% on a year-on-year basis, indicating that the company's operating profit is under pressure.

Net Profit: Adani Power reported a net profit of ₹12,749.61 crore in FY25 compared to ₹20,828.79 crore in FY24. It showed a decrease of -38.79% on a yearly basis, indicating a negative performance.

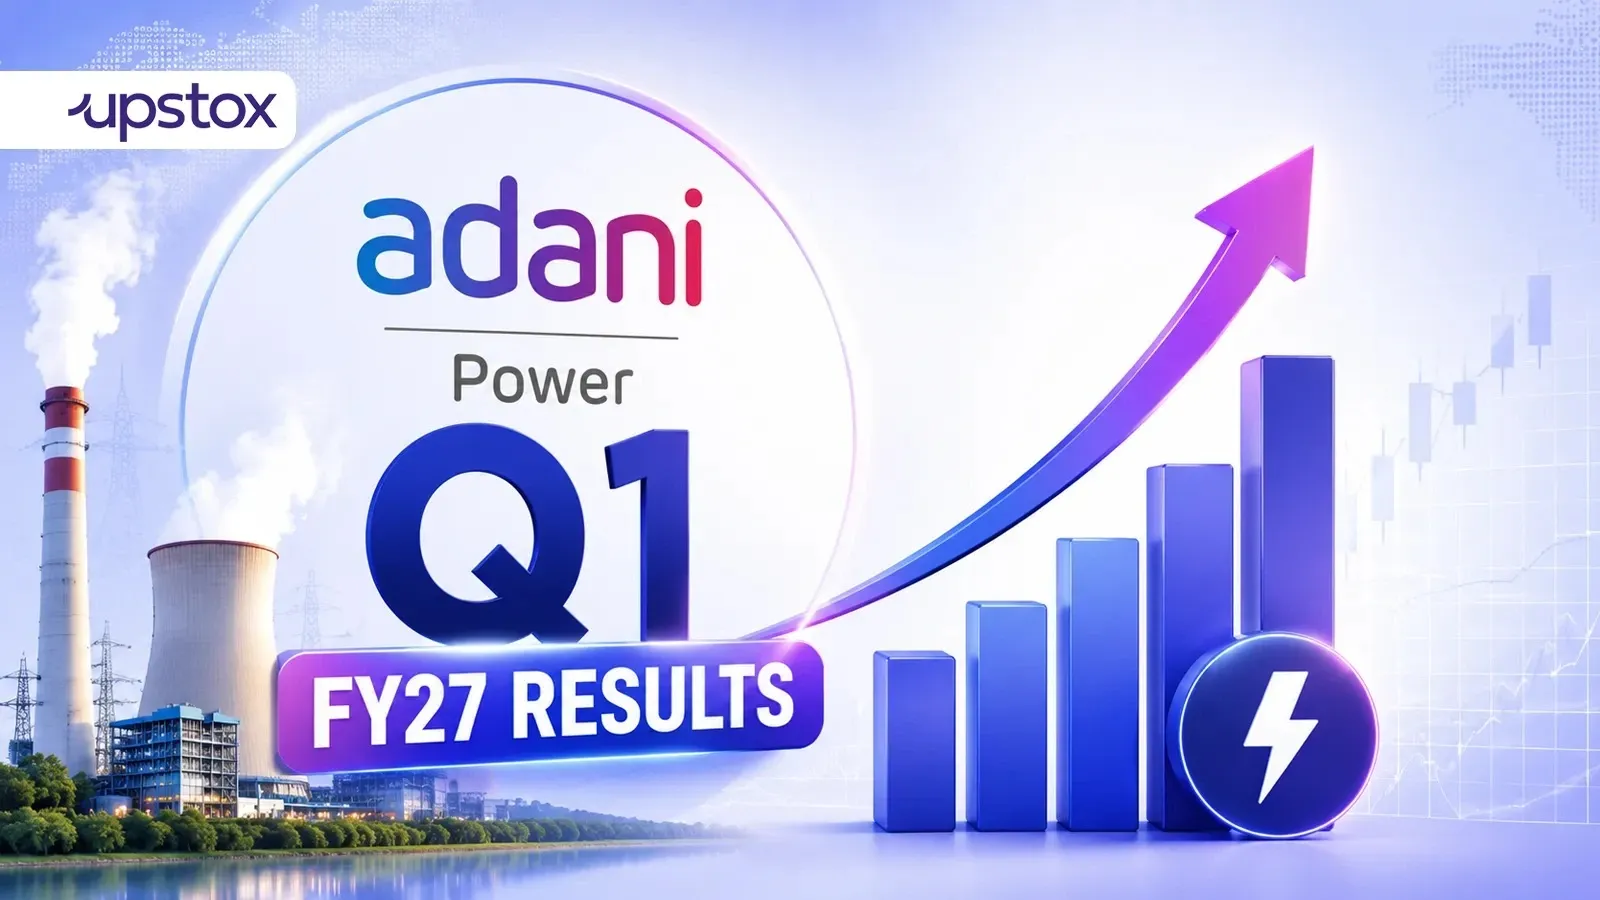
Adani Power Q3 FY26 Results

In Q3 FY26, Adani Power reported a consolidated net profit of ₹2,488.09 crore compared to ₹2,940.07 crore in Q3 FY25, down by -15.37% on a YoY basis. In the last quarter, Adani Power’s net profit was ₹2,906 crore. Therefore, on a quarter-on-quarter (QoQ) basis, net profit declined by -14.38%.

During the quarter, Adani Power posted a revenue of ₹12,717 crore vs ₹13,434 crore in Q3 FY25, down by -5.33% on a YoY basis. In Q2 FY26, the revenue was ₹13,457 crore. Therefore, on a quarter-on-quarter (QoQ) basis, revenue falls by -5.49%.

Adani Power’s EBITDA declined by -15% at ₹4,238 crore compared to ₹5,024 crore in Q3 FY25. The EBITDA margin narrowed to 34%, compared with 36.7% in the same period last year.

Adani Power Financial Highlights

  • Revenue: Adani Power reported revenue of ₹57,865.28 crore in FY26 vs ₹58,905.83 crore in FY25. It showed a decrease of 1.77% on a yearly basis.
  • Operating Profit: Adani Power reported an operating profit of ₹15,499.51 crore in FY26 vs ₹16,359.51 crore in FY25. It showed a decrease of 5.26% on a year-on-year basis.
  • Net Profit: Adani Power reported a net profit of ₹12,971.08 crore in FY26 vs ₹12,749.61 crore in FY25. It showed an increase of 1.74% on a yearly basis.

Adani Power Quarterly Result Highlights

  • Adani Power reported revenue of ₹15,989.09 crore in Mar 2026, compared with ₹12,994.70 crore in Dec 2025, representing an increase of 23.04% on a quarter-on-quarter (QoQ) basis.
  • Adani Power reported an operating profit of ₹4,383.98 crore in Mar 2026, compared with ₹2,945.02 crore in Dec 2025, representing an increase of 48.86% on a quarter-on-quarter (QoQ) basis.
  • Adani Power reported a profit of ₹4,271.40 crore in Mar 2026, compared with ₹2,488.09 crore in Dec 2025, reflecting an increase of 71.67% on a QoQ basis.
  • The earnings per share (EPS) of Adani Power stood at ₹6.62 during Mar 2026.
Know more
Promoters
74.96%
FII
11.74%
Other DII
0.07%
Retail and other
9.62%
Mutual funds
3.62%
Foreign institutions - FII
Compare against other stocks
Adani Power logo
Adani Power
Power Generation & Distribution
Add Stock
Add Another

FAQs on Adani Power Share Price