ITC Limited is an India-based diversified conglomerate company with a leading business in cigarettes, fast-moving consumer goods (FMCG), hotels, paperboards, packaging and agribusiness.
ITC is headquartered in Kolkata, India, and is known for its well-established brands, such as Aashirvaad Atta, Sunfeast, Bingo, Classmate and more. ITC’s scale and brand portfolio makes its one of India’s largest companies in terms of market capitalization.
Brief History of ITC Limited
ITC Limited (Imperial Tobacco Company of India) was founded in 1910, initially focusing on cigarette and tobacco manufacturing. Over the years, ITC diversified its business into hotels, FMCG, packaging, agribusiness and information technology.
In 1974, ITC entered the hospitality sector, followed by agribusiness in 1990. Due to its diversified business and presence, the company name was changed to ITC Limited in 2001. Today, ITC is a listed leading conglomerate with a market capitalization of ₹4 lakh+ crore, and the ITC share price is highly traded in the share market.
ITC Limited Business Segments
ITC Limited's diversified segment structure helps in maintaining a stable cash flow with long-term growth opportunities. Below are list of its core business segments.
-
Cigarettes: ITC Limited holds a leading market share in India’s cigarette industry with famous brands such as Gold Flake, Classic, Navy Cut and India Kings. This segment generates the highest revenue for ITC and contributes the maximum share in profits.
-
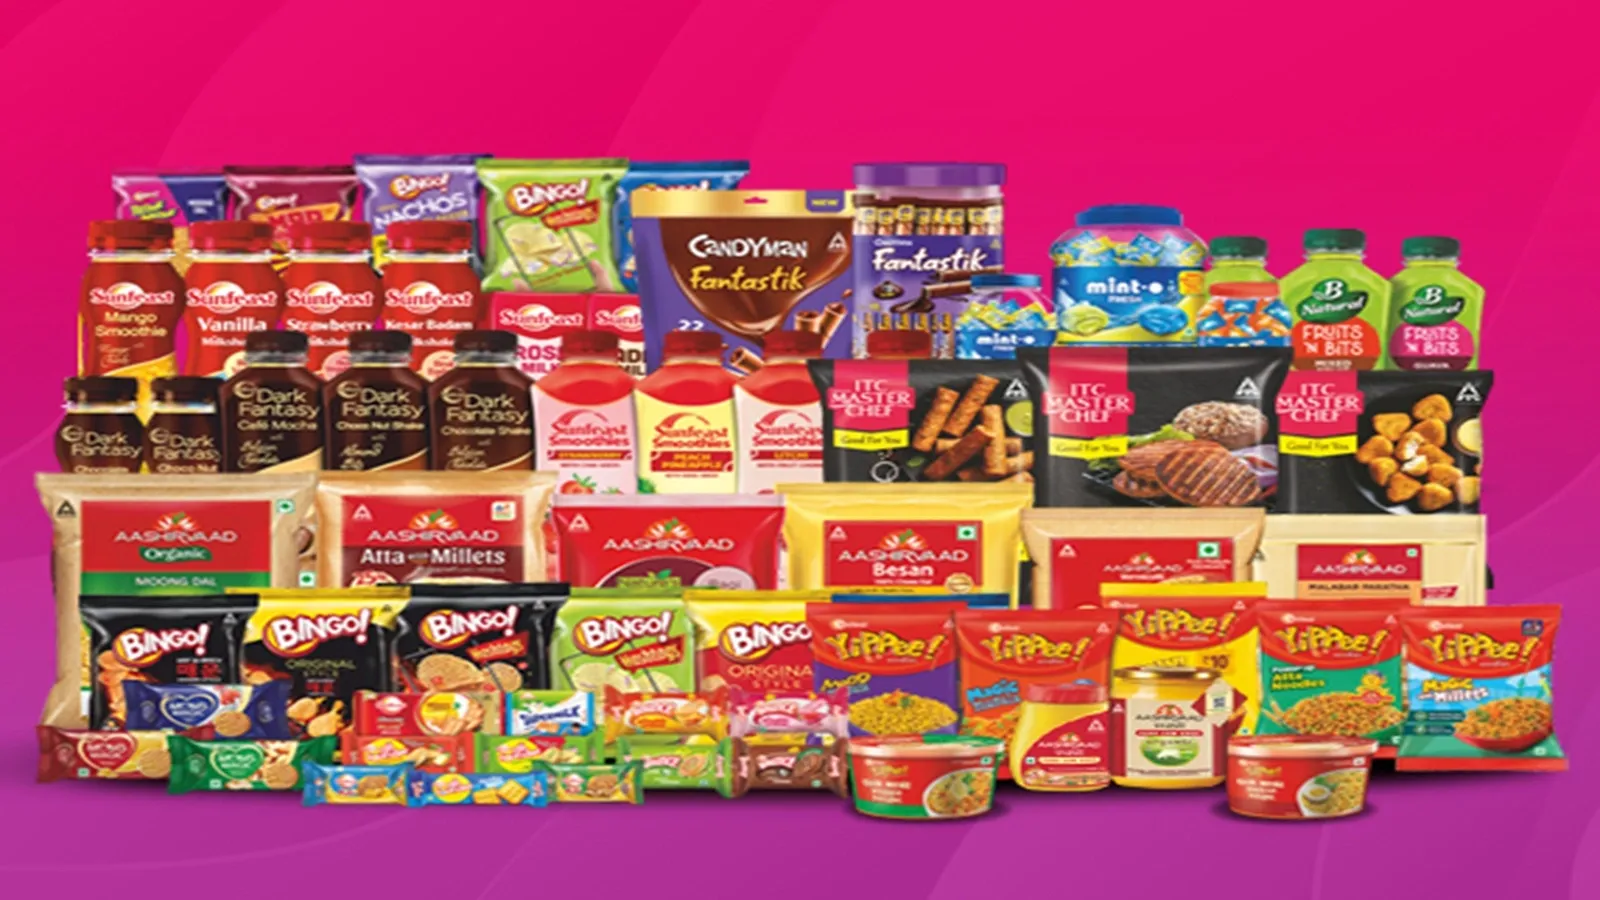
FMCG: ITC's fast-moving consumer goods segment includes packaged foods, personal care products, hygiene products, education and stationery. The key brands include Aashirvaad, Sunfeast, Bingo, Yippee, Classmate, etc.
-
Hotels: ITC Hotels operates luxury, premium and mid-size properties across India under the brands such as ITC Hotels, Welcomhotel, Fortune and Mementoes.
-
Paper and Packaging: This segment is involved in manufacturing paperboards, speciality papers, packaging solutions, serving FMCG, pharma, food and export markets.
-
Agribusiness: ITC’s agribusiness segment focuses on sourcing, processing and exporting agricultural commodities such as rice, wheat, spices, coffee and more.
-
IT Services: ITC Infotech is involved in providing digital transformation and technology solutions to global clients.
-
Other Businesses: The other business includes match boxes, Agarbatti, dairy products and more, which support term diversification.
ITC Management Details
Mr Sanjiv Puri is the Chairman and Managing Director of ITC Limited. He leads the ITC’s strategic direction and diversification efforts.
The company has a board of directors and an executive management committee that runs the individual business segments. ITC’s leadership team is active in brand investment and sustainability initiatives. For detailed information regarding the company’s management, visit the ITC official website.
ITC Limited SWOT Analysis
Let’s look into strength, weaknesses, opportunities and threats of the ITC business.
Strength
- Market leader in cigarettes with consistent cash flow.
- Diversified product portfolio.
- Strong brand name and vast distribution network
- Strong balance sheet and dividend-paying company.
Weaknesses
- High dependency on the tobacco segment for the revenue and profits.
- High taxes on tobacco products
- Heavy regulations.
- FMCG segment’s non-cigarette margins are still lower than its competitors.
Opportunities
- Growth in FMCG and other segments.
- Expansion in rural areas
- Export growth in agribusiness and value-added paper products.
Threats
- Rise in health regulations and anti-tobacco policies.
- High competition from other FMCG giants.
- Volatility in agricultural raw material prices.
ITC Financial Performance (FY25 vs FY24)
Revenue: ITC reported a revenue of ₹77,853.03 crore in FY25 vs ₹70,625.16 crore in FY24. It showed a year-on-year increase of 10.23%, reflecting decent revenue growth.
Operating Profit: The company reported an operating profit of ₹26,926.94 crore in FY25 vs ₹26,400.28 crore in FY24. It showed a year-on-year increase of 1.99%, indicating that the company continues to earn well after deducting direct costs and operating expenses.
Net Profit: ITC Limited reported a net profit of ₹35,052.48 crore in FY25 compared to ₹20,751.36 crore in FY24. It showed a strong year-on-year increase of 68.91%, indicating robust performance.
ITC Financial Highlights
- Revenue: ITC reported revenue of ₹81,294.20 crore in FY26 vs ₹77,853.03 crore in FY25. It showed an increase of 4.42% on a yearly basis.
- Operating Profit: ITC reported an operating profit of ₹28,033.39 crore in FY26 vs ₹26,926.94 crore in FY25. It showed an increase of 4.11% on a year-on-year basis.
- Net Profit: ITC reported a net profit of ₹21,018.15 crore in FY26 vs ₹35,052.48 crore in FY25. It showed a decrease of 40.04% on a yearly basis.
ITC Quarterly Result Highlights
- ITC reported revenue of ₹19,770.08 crore in Jun 2026, compared with ₹18,409.83 crore in Mar 2026, representing an increase of 7.39% on a quarter-on-quarter (QoQ) basis.
- ITC reported an operating profit of ₹5,860.85 crore in Jun 2026, compared with ₹7,172.62 crore in Mar 2026, representing a decrease of 18.29% on a quarter-on-quarter (QoQ) basis.
- ITC reported a profit of ₹4,508.79 crore in Jun 2026, compared with ₹5,469.74 crore in Mar 2026, reflecting a decrease of 17.57% on a QoQ basis.
- The earnings per share (EPS) of ITC stood at ₹16.52 during Jun 2026.
Data Source: BSE, Company announcements
Securities shown are illustrative, not recommendations. Past performance does not guarantee future results.