Option Strategies
Introduction to the Bull Call Spread
Introduction to the Bull Call Spread
Picture this - You have just bought a big, expensive new house. You’ve broken the bank to do this, but you have big plans to convert the extra room in the house into a media-cum-gaming room. Weeks turn into months and years and you don’t get round to making that media room. But you are still paying off the humongous EMI. A friend with a college-age daughter approaches you and asks if you could suggest a place on rent near the university. That’s when it clicks. You rent out the room to your friend’s daughter. She gets a roof, and you get rent which helps reduce the burdensome EMI.
Bull Call Spreads, and other spreads in general, work in a similar way. You purchase one unit and sell another one at a higher price which reduces your cost of entering into the position. How does such a strategy help traders? Read on.
How do you construct a long bull call spread?
A Bull Call Spread consists of purchasing a call option at one strike price and selling another call option at a higher strike price. Both the bought and sold call options will have the same expiration date.
When you sell a call option, you will receive the premium associated with the option. This is unlike the premium you pay when buying a call option. Due to this combination of buying and selling of a call option, the net cost of entering this strategy will be cheaper than simply entering into a long call trade.
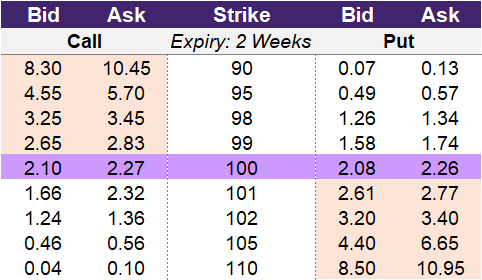
The table below is an example of an option chain that gives bid and offer prices for 5 strikes associated with calls and puts of the same expiry. If you were ready to place a trade for a long bull call spread strategy, you would look to the left side of the option chain for the call option section.
Illustration 1: Bull Call Spread Option Chain
 Source: Upstox
Let’s look at two quick examples: You could enter a 100-102 Bull Call Spread or a 100-105 Bull Call Spread.
The 100-102 spread involves buying the 100-strike call option and selling the 102-strike call option. The cost to buy the 100-strike is 2.27. When you sell the 102-strike, you will receive the amount of the bid price, which is 1.24. The net cost, or net premium paid, to enter the 100-102 bull call spread is 1.03 (2.27 – 1.24).
The 100-105 spread will cost 2.27 to buy the 100-strike, and you will receive 0.46 in premium by selling the 105-strike. The net cost to enter the 100-105 bull call spread is 1.81 (2.27-0.46).
Why would you choose the 100-105 bull call spread when it costs more than the 100-102 bull call spread? The answer is that there is a difference in max profit potential. Read on to learn more.
A trader will enter into a Bull Call Spread Strategy if they believe two things:
- The underlying stock or index will move upward but not drastically upward AND
- They expect this upward move to occur before the selected expiration date of the option.
What is the max profit of a long bull call spread?
Key Formula:
- Long Bull Call Spread Max Profit = Higher Strike Price – Lower Strike Price – Net Premium Paid
- Net Premium Paid = Debit from Long Call – Credit from Short Call
The maximum profit from this strategy is the difference between the two strikes minus the net cost to enter the trade. In the two examples above, there were two Bull Call spreads 100-102 and 100-105.
How much can you lose trading a long bull call spread?
Key Formula:
- Long Bull Call Spread Maximum Loss = Net Premium Paid
- Net Premium Paid = Debit from Long Call – Credit from Short Call
With a bull call spread, you can have a limited maximum loss, which is the premium paid for entering into the strategy. To enter into the strategy, you will pay a premium to purchase the long call option. You will also receive a credit when you short the corresponding short call option that has a higher strike. Because the short call option has a higher strike price, it is further out-of-the-money than the purchased call option. This means that the credit received for the short call option won’t offset the cost to buy the lower strike call option. This leads to the strategy requiring a paid premium. A bull call spread is a debit spread and could also be referred to as a debit call spread or vertical call spread.
What is the breakeven point when entering a long bull call spread?
Key Formula:
- Long Bull Call Spread Breakeven Point = Lower Strike Price (Long Call Strike Price) + Net Premium Paid
- Net Premium Paid = Debit from Long Call – Credit from Short Call
The breakeven point when entering into a bull call spread is the price of the underlying at which the trader can make a profit. Similar to a long call, a bull call spread will have one breakeven point. To make a profit, the price of the underlying asset needs to move above the breakeven point. The breakeven point is the strike price of the long call option plus the total premium paid to enter into the bull call spread.
A reminder about breakeven points is that these are for expiration. An option has both time value and intrinsic value prior to expiration. On expiration, an option only has intrinsic value. Because an option has time value remaining prior to expiry, the breakeven point of an option strategy will be less than on expiration. This is because a trader can exit the individual option contracts for a higher premium prior to expiry due to the presence of time value.
What is the profit formula for a long bull call spread?
Key Formula:
- Long Bull Call Spread Payoff = Max(0, Underlying Price – Lower Strike Price) – Max(0, Underlying Price – Upper Strike Price)
- Long Bull Call Spread Profit = Max(0, Underlying Price – Lower Strike Price) – Max(0, Underlying Price – Upper Strike Price) – Net Premium Paid
- Net Premium Paid = Debit from Long Call – Credit from Short Call
The profit formula for a bull call spread combines the profit formulas for a long call and a short call. The payoff formula for a long call is the maximum of 0 or the underlying price on expiration less the strike price. The payoff formula for a short call is the same as a long call except it is negative. To calculate the profit, the payoff of the two options is reduced by the net premium paid to enter into the bull call spread.
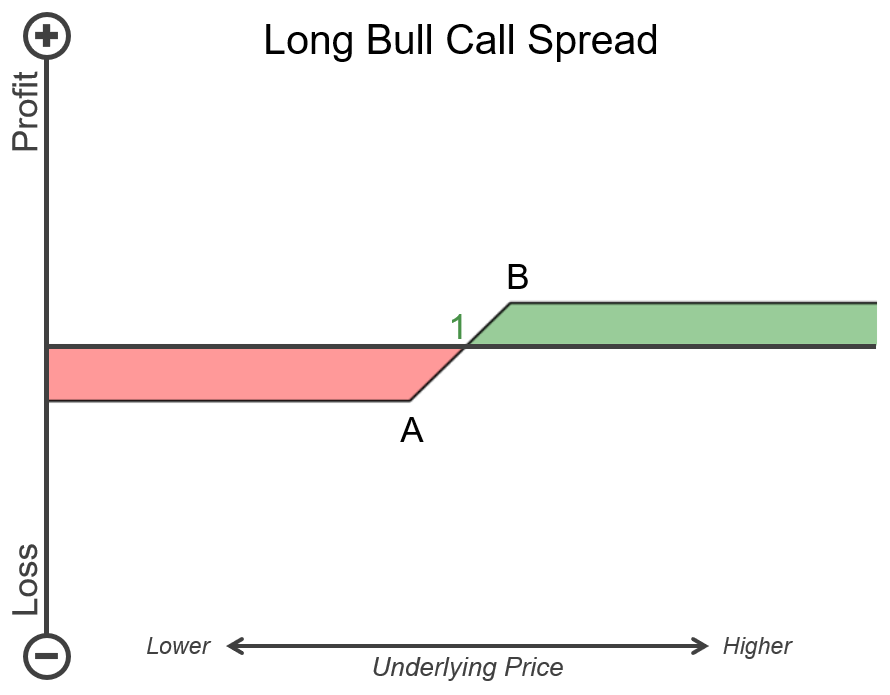
What is the payoff diagram for a long bull call spread?
Below is an example P&L diagram for a long bull call spread. The vertical axis is the profit and loss where the higher up represents more profit and further down is a higher loss. The horizontal is the underlying price. Further to the right is a higher underlying price and further to the left is a lower underlying price. Point A on the chart is the strike price selected for the long call option and Point B is the strike price selected for the short call option. Point 1 is the breakeven point for the strategy. As the underlying price increases to Point 1 and then moves above this price point, the strategy will become profitable. Areas that are shaded green are when bull call spread will have a positive payoff and areas shaded red are when the long bull call spread will have a negative payoff. As you can see by the chart, there is a point where both the profit and loss don’t move any higher or lower. This is because the strategy has capped profit potential as well as capped loss potential. The max profit will occur when the underlying is at or above the upper strike price. The upper strike price is the short call strike price. The max loss will occur when the underlying is at or below the lower strike price. The lower strike price is the long call strike price.
Illustration 2
 Source: Upstox
What is the point of max profit for a long bull call spread?
Key Formula:
- Price of Underlying >= Upper Strike Price (short call strike)
The point of max profit will occur once the underlying reaches the upper strike price. When you sell a call option, you give the buyer of the option the right to buy the underlying stock at the strike price. Once the underlying moves above that strike price, you are no longer entitled to those gains as you sold those to the buyer of the option. You did this in exchange for receiving an upfront premium that helped offset the cost of the long call option.
What is the point of max loss for a long bull call spread?
Key Formula:
- Price of Underlying <= lower strike price (long call strike)
The most you can lose with a bull call spread is the net premium paid to enter into the strategy. If the underlying is above the strike price of the long call option, then the strategy will be valuable on expiration. However, if the underlying isn’t above the breakeven point on expiration, then the value the strategy has may not be enough to cover the cost of entering into the strategy to be profitable. For example, if the strategy cost ₹100 but the strategy is worth ₹25 on expiry, technically the trade didn’t expire worthless – which is the max loss – but it won’t be profitable. The point of max loss occurs if the underlying expires at the long call strike price or lower. If this happens, then the strategy will be worthless on expiry and you will lose the cost to enter the trade which is the most you can lose.
What is the difference between buying a bull call spread and buying a call? Compared to a long call, a bull call spread is a more complex option strategy that involves buying one call option and selling another call option with a higher strike price. Both a bull call spread and long call allow a trader to potentially profit from an upward price movement in the underlying security. In addition, both a bull call spread and long call also have fixed upfront costs, limited downside, and our debit strategies. The biggest difference is that a call spread has fixed upside while a call has theoretically unlimited upside. Because a call spread involves shorting a call, the trader will receive a credit which partly offsets the price of the long call leading to a lower cost to enter into the call spread as compared to the long call. Because of the lower cost of entry, the call spread will have a lower breakeven point and higher probability of profit as compared to a corresponding long call.
Summary
- Use a Bull Call Spread strategy when you expect the underlying to rise, but not drastically.
- In a bull call spread strategy, you buy a call option at one strike price and sell the same option at a higher strike price. The date of expiry for both strikes is the same.
- Maximum loss is capped at the price you paid to enter the strategy.
- Cost to enter a trade is lower in a bull call spread as compared to a long call trade.
- Break-even cost for a bull call spread is lower than a long call. The break-even for a bull call spread could be substantially lower such that you reach maximum profit with a bull call spread before you would break-even for the long call.
- Likelihood of profitability in a spread strategy is higher as compared to a long call trade.
Is this chapter helpful?
- Home/
- Introduction to the Bull Call Spread