Adani Enterprises Share Price

₹ 2,706.30

-₹24.70 (-0.9%)
1D
Last updated 09 Nov, 2026, 15:58 IST
NSE: ADANIENT
|
Trading

Adani Enterprises Share Price Today

As of 10 Nov 2026, Adani Enterprises share price is ₹2,706.30. The stock opened at ₹2,742.00, compared to its previous close of ₹2,731.00. During today's trading session, Adani Enterprises share price moved in the range of ₹2,695.00 to ₹2,750.20, with an average price of ₹2,722.60 for the day. Looking at its last 52-week, the stock has touched a low of ₹1,753.00 and a high of ₹3,245.00. On the performance front, Adani Enterprises share price has increased by 8.00% over the last six months and is up 14.22% on a year-on-year basis.

Share price over the last 1 day fell from 2743.60 to 2706.30, ranging between 2696.60 and 2743.60.

₹2,695.00
0.90% down today
₹2,750.20
1D LOW
1D HIGH

Adani Enterprises Stock Insights

Latest Earning
Op Profit TrendUp by 248.37% QoQ
Latest Earning
Net Profit TrendUp by 167.25% QoQ
Latest Earning
Revenue TrendUp by 13.35% QoQ
Stock Performance
OutperformingBeat Nifty by 4.72 % in last 6 month
Shareholding Pattern
DIIDII decreased stake by 0.30%
Shareholding Pattern
FIIFII increased stake by 1.42%
Adani Enterprises stock performance
Open₹2,742.00
High₹2,750.20
Low₹2,695.00
Prev. close₹2,731.00
Adani Enterprises trading activity
Volume8,54,200
Average traded price₹2,713.69
Last traded time03:58:12 09 Nov
Last traded quantity150

Circuit
L
H
₹2,624.20
₹2,786.40
52-week
L
H
₹1,753.00
₹3,245.00
Mkt Cap Cr
3,69,499.97

P/E
69.47

P/B
3.77

ROA
1.66%
ROE
3.66%

ROCE
5.85%

Quick Ratio
0.72

EV/EBITDA
19.93

Based on fundamentals, this stock's

Performance: 2 out of 5, Poor
Performance
Poor
Adani Enterp. has underperformed the market
Valuation: 1 out of 5, Overvalued
Valuation
Overvalued
Adani Enterp. appears overvalued compared to its peers
Earnings: 5 out of 5, Excellent
Earnings
Excellent
Adani Enterp. revenue, operating profit and net profit are growing
Peer Comparison
Peer comparison — key ratios
NameMkt Cap CrP/EP/BROAROEROCEQuick RatioEV/EBITDA
PREMIER ENERGIES LIMITED40,583.2622.547.7714.0%34.23%27.88%1.215.03
Aegis Logistics40,036.8226.576.29.92%20.01%19.34%1.6716.73
Redington25,603.1116.72.443.79%18.62%16.15%1.0611.23
HONASA CONSUMER LIMITED15,325.3854.1110.3112.27%19.03%23.64%1.435.59
SG MART LIMITED11,087.6173.046.517.33%8.91%13.42%2.3440.42
LLOYDS ENTERPRISES LTD9,791.9735.581.712.07%1.79%5.26%2.4324.65
AUGMONT ENTERPRISES LTD8,422.8125.25.1216.92%19.77%28.14%2.7116.82
MMTC8,157.0018.253.8516.0%4.72%7.79%3.48.56
GNG ELECTRONICS LIMITED6,659.4141.558.110.21%19.5%16.76%0.926.88
Arvind Fashions4,718.4423.934.824.12%13.34%16.62%0.638.0

Auto-generated based on historical fundamentals; not a recommendation to buy/sell.

Adani Enterprises Company Background

ISIN
INE423A01024
Sector Market Cap
₹ 369,499.97 Cr

Established in: 1988

Managing Director: Rajesh Adani

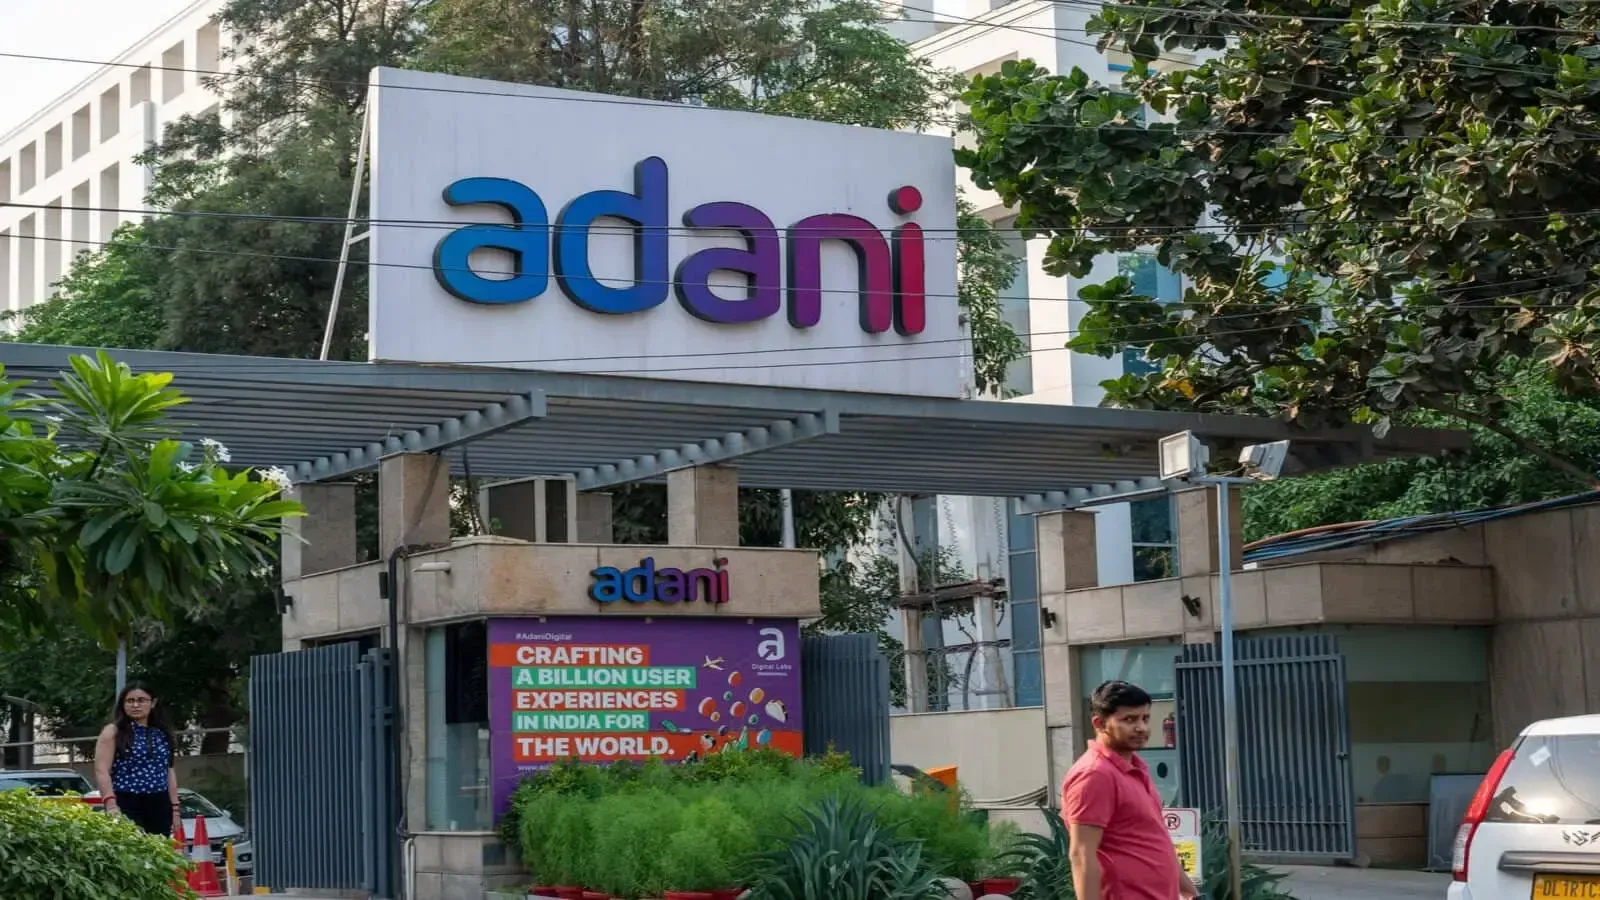
Adani Enterprises Limited (AEL) is a multinational holding company known for executing large-scale projects in the energy and infrastructure sectors in India. The company is headquartered in Ahmed, Gujarat and is primarily specialised in mining and trading of coal and iron ore. Adani Enterprises has business interests in airport operations, edible oils, road, rail, data centres, and solar infrastructure.

Adani Enterprises Limited launched its IPO and went public in the mid-1990s, listing on BSE and NSE under the ticker symbols of 512599 and ADANIENT, respectively.

History of Adani Enterprises Limited

Adani Enterprises Limited was founded by Gautam Adani in 1988 as a mid-sized trading firm called Adani Exports to trade agricultural commodities, polymers, metals and textiles. In the mid-1990s, the company went public with an IPO that was oversubscribed 25 times, and its shares were listed on both the BSE and the NSE.

The company expanded significantly and became India’s net foreign exchange earner, securing the contract to develop the Mundra Port in Gujarat. In the 2000s, the company entered the city gas distribution and the mining and natural resources industry.

The company is mainly involved in Adani Group’s integrated resource management, power trading and natural resources businesses. Adani Enterprises Limited acts as an incubator for Adani Group’s new businesses until they are steady enough to be demerged and incorporated as a separate entity.

Business Segments of Adani Enterprises Limited

The following are the business segments of Adani Enterprises Limited.

  • Energy and Utility

The company focuses on producing and manufacturing green hydrogen, solar photovoltaic (PV) and wind turbines. It has entered into a joint venture with EdgeConneX and set up AdaniConneX to build a network of massive, cloud-neutral green data centres in India.

  • Transport

The company focuses on developing, constructing, and operating national highways, expressways, metro rails and tunnels through Adani Roads Transport. Adani Airport Holdings operates and oversees major commercial airports in the country to evolve them into integrated transport hubs. Mining

Adani Enterprises Limited is a pioneer of the Mine Developer and Operator (MDO) model and offers end-to-end mining services. It offers global coal trading, bunkering and logistics services to power and industrial sector companies.

The company is also venturing into the defence and aerospace sector, designing and manufacturing systems. It also incubates various products and is developing water treatment and distribution infrastructure.

Future Plans of Adani Enterprises Limited

The following are the future plans of Adani Enterprises Limited.

  • AI Data Centres

The company is collaborating with Jabil Incorporated to build a huge vertically integrated AI and data centre hardware manufacturing network in India. The company has pledged $100 billion by 2035 to construct 5GW of hyperscale, AI-ready data centres that would be powered by green energy. Adani Enterprises Limited is setting up India’s largest data centre campus in Visakhapatnam in partnership with Google.

  • Transport Incubation

The company is investing significantly in the airport sector and is focusing on commercial space developments to earn non-aero revenues.

  • Giga Factories

Adani Enterprises Limited is setting up integrated giga-factories in Gujarat to manufacture 10 GW of solar panels, 10 GW of wind turbines and 5 GW of hydrogen electrolysers.

Awards and Recognition Received by Adani Enterprises Limited

The following are the awards and recognition earned by Adani Enterprises Limited.

  • Golden Peacock Award for Excellence in ESG in 2025 by the Institute of Directors (IOD)
  • Transformance ESG Awards by Great Indian ESG Organisation of the Year in 2025
  • BW India’s Most Sustainable Companies (IMSC) by Top 60 Ranking
  • Prix Versailles by the World's Most Beautiful Airports List in 2026
  • The Tech Capital Awards by Digital Infrastructure Project of the Year 2023
  • Indian Chamber of Commerce (ICC) Awards for Leadership in Climate Action in 2025
  • Indian Chamber of Commerce (ICC) Awards for Outstanding Contribution to Circular Economy in 2025
  • Frost & Sullivan Company of the Year Award in 2023
  • Golden Peacock Eco-Innovation Award

Adani Enterprises Financial Highlights

  • Revenue: Adani Enterprises reported revenue of ₹1,02,943.24 crore in FY26 vs ₹1,00,365.08 crore in FY25. It showed an increase of 2.57% on a yearly basis.
  • Operating Profit: Adani Enterprises reported an operating profit of ₹13,524.65 crore in FY26 vs ₹10,478.74 crore in FY25. It showed an increase of 29.07% on a year-on-year basis.
  • Net Profit: Adani Enterprises reported a net profit of ₹9,693.50 crore in FY26 vs ₹7,497.26 crore in FY25. It showed an increase of 29.29% on a yearly basis.

Adani Enterprises Quarterly Result Highlights

  • Adani Enterprises reported revenue of ₹38,023.11 crore in Sep 2026, compared with ₹33,546.26 crore in Jun 2026, representing an increase of 13.35% on a quarter-on-quarter (QoQ) basis.
  • Adani Enterprises reported an operating profit of ₹2,002.02 crore in Sep 2026, compared with ₹1,349.38 crore in Jun 2026, representing an increase of 248.37% on a quarter-on-quarter (QoQ) basis.
  • Adani Enterprises reported a profit of ₹1,054.70 crore in Sep 2026, compared with ₹1,568.42 crore in Jun 2026, reflecting an increase of 167.25% on a QoQ basis.
  • The earnings per share (EPS) of Adani Enterprises stood at ₹75.66 during Sep 2026.

Data Source: BSE, Company announcements

Securities shown are illustrative, not recommendations. Past performance does not guarantee future results.

Promoters
71.97%
FII
10.66%
Other DII
4.01%
Retail and other
6.75%
Mutual funds
6.62%
Foreign Institutional Investor (FII)
FII shareholding by period
Mar 202610.80%
Jun 20268.77%
Jul 202610.52%
Sep 202610.66%

Adani Enterprises Investment Returns

1 day
-0.90%

1 week
+4.36%

1 month
+2.73%

1 year
+14.22%

3 years
+22.20%

5 years
+65.48%

Adani Enterprises Share Price History

Adani Enterprises share price history by day, showing open and close prices and the percentage change
Day
Open / Close
Change %
09 Nov 26
₹2,742.00 / ₹2,706.30
-0.90%
08 Nov 26
₹2,750.00 / ₹2,731.00
-0.54%
06 Nov 26
₹2,729.90 / ₹2,745.80
+0.46%
05 Nov 26
₹2,749.00 / ₹2,733.30
+0.89%
Show more

Adani Enterprises Financials

Full statement

Income Statement · Consolidated

Income Statement · Consolidated — all values in INR Crore
ParticularsMar 2026Mar 2025Mar 2024Mar 2023
Revenue₹100,468.61₹97,894.75₹96,420.98₹127,539.50
Other Income₹2,474.63₹2,470.33₹1,860.53₹1,194.59
Total Revenue₹102,943.24₹100,365.08₹98,281.51₹128,734.09
Total Expenses₹98,633.95₹93,832.07₹92,641.23₹125,126.85
Profit Before Tax₹13,524.66₹10,478.74₹4,924.91₹3,237.92
Tax₹3,831.15₹2,968.52₹1,631.51₹1,037.94
Profit After Tax₹9,693.51₹7,510.22₹3,293.40₹2,199.98
EPS - Basic₹75.66₹58.79₹27.24₹21.78
EPS - Diluted₹73.59₹58.79₹27.24₹21.78

Cash Flow · Consolidated

Cash Flow · Consolidated — all values in INR Crore
ParticularsMar 2026Mar 2025Mar 2024Mar 2023
Profit before tax₹13,524.66₹10,461.42₹4,926.56₹3,249.90
Income before WC changes₹15,148.21₹15,445.25₹12,048.79₹9,191.04
Change in Assets-₹16,641.88-₹3,937.74-₹399.95-₹5,450.79
Change in Liabilities₹6,562.93-₹4,899.69₹371.25₹14,796.18
Change in WC-₹10,078.95-₹8,837.43-₹28.70₹9,345.39
Cash flow from Operations₹2,356.91₹4,513.10₹10,312.19₹17,626.46
Cash flow from Investing-₹28,438.01-₹26,966.61-₹19,082.18-₹16,860.09
Cash flow from Financing₹28,484.47₹22,655.34₹8,878.68-₹1,197.52
Total Cash Flow₹3,160.89₹751.11₹472.34₹970.10
Cash (Start of the year)₹3,105.78₹2,354.67₹1,882.33₹912.23
Cash (End of the year)₹6,266.67₹3,105.78₹2,306.55₹1,882.33

Balance Sheet · Consolidated

Balance Sheet · Consolidated — all values in INR Crore
ParticularsMar 2026Mar 2025Mar 2024Mar 2023
Non-Current Assets₹200,641.66₹157,409.65₹124,205.70₹104,466.09
Current Assets₹60,958.69₹40,725.89₹36,526.15₹37,021.73
Total Assets₹261,600.35₹198,135.54₹160,731.85₹141,487.82
Current Liabilities₹58,912.25₹47,383.15₹44,058.11₹44,803.05
Net Current Asset₹2,046.44-₹6,657.26-₹7,531.96-₹7,781.32
Non-Current Liabilities₹113,509.85₹94,281.94₹72,487.45₹58,794.72
Equity Capital₹89,178.25₹56,470.45₹44,186.29₹37,890.05
Total Equity & Liabilities₹261,600.35₹198,135.54₹160,731.85₹141,487.82

Income Statement · Standalone

Income Statement · Standalone — all values in INR Crore
ParticularsMar 2026Mar 2025Mar 2024Mar 2023
Revenue₹23,056.18₹26,708.97₹32,012.03₹57,886.45
Other Income₹2,601.26₹1,604.07₹1,667.12₹1,264.74
Total Revenue₹25,657.44₹28,313.04₹33,679.15₹59,151.19
Total Expenses₹23,097.60₹25,279.00₹29,883.76₹56,877.76
Profit Before Tax₹12,159.48₹6,904.08₹3,795.39₹2,201.76
Tax₹781.42₹850.89₹952.36₹587.99
Profit After Tax₹11,378.06₹6,053.19₹2,843.03₹1,613.77
EPS - Basic₹93.26₹51.15₹24.95₹14.29
EPS - Diluted₹90.71₹51.15₹24.95₹14.29

Cash Flow · Standalone

Cash Flow · Standalone — all values in INR Crore
ParticularsMar 2026Mar 2025Mar 2024Mar 2023
Profit before tax₹12,159.48₹6,886.76₹3,797.04₹2,213.74
Income before WC changes₹2,434.52₹2,891.27₹2,903.47₹1,985.85
Change in Assets-₹2,398.81₹3,137.40₹1,668.38-₹1,069.46
Change in Liabilities-₹2,532.34-₹8,968.79-₹3,105.31₹10,802.80
Change in WC-₹4,931.15-₹5,831.39-₹1,436.93₹9,733.34
Cash flow from Operations-₹3,240.15-₹3,731.64₹507.88₹11,187.32
Cash flow from Investing-₹15,490.93-₹6,465.99-₹2,465.88-₹16,008.75
Cash flow from Financing₹21,005.78₹9,940.95₹2,099.57₹5,110.32
Total Cash Flow₹2,274.70-₹256.68₹141.57₹288.89
Cash (Start of the year)₹237.37₹445.93₹304.36₹63.59
Cash (End of the year)₹2,512.07₹237.37₹445.93₹352.48

Balance Sheet · Standalone

Balance Sheet · Standalone — all values in INR Crore
ParticularsMar 2026Mar 2025Mar 2024Mar 2023
Non-Current Assets₹49,873.53₹26,359.77₹17,344.36₹12,833.55
Current Assets₹32,351.51₹23,978.36₹24,836.01₹27,303.72
Total Assets₹82,225.04₹50,338.13₹42,180.37₹40,137.27
Current Liabilities₹11,871.23₹13,836.95₹21,260.75₹24,960.47
Net Current Asset₹20,480.28₹10,141.41₹3,575.26₹2,343.25
Non-Current Liabilities₹7,574.82₹9,802.29₹4,280.08₹1,243.02
Equity Capital₹62,778.99₹26,698.89₹16,639.54₹13,933.78
Total Equity & Liabilities₹82,225.04₹50,338.13₹42,180.37₹40,137.27
* All values are in INR Crore
Adani Enterprises market depth
Bid quantityBid priceAsk priceAsk quantity
002706.3559
0000
0000
0000
0000
Total bid quantity0
Total ask quantity559
Adani Enterprises technical summary
Bearish indicators4
Neutral indicators3
Bullish indicators1
OverallSlightly Bearish
by SEBI experts

Expert Pick

EXPPICK
Stop-loss
Stop-loss is locked. Sign in to view.

Entry price
Entry price is locked. Sign in to view.
Target
Target is locked. Sign in to view.
Indicator
Value
Verdict

RSI (14)
53.44
Neutral

ATR (14)
78.48
Neutral

STOCH(9,6)
84.02
Bearish

STOCH RSI (14)
94.97
Bearish

ADX(9)
32.82
Bearish

UO(9)
61.29
Neutral

ROC(12)
7.1
Bullish

WillR(14)
-15.43
Bearish
Period
Simple value
Exponential vaue

5D
2702.52
2703.01

10D
2628.51
2665.89

20D
2625.59
2668.81

50D
2804.66
2761.57

100D
2934.19
2786.91
Volume trend — traded volume by day
9 Nov8L
8 Nov1L
6 Nov12L
5 Nov12L
4 Nov22L
3 Nov7L
Average10L

Technical indicators used here are for indicative purposes only. Kindly do not treat it as an investment or trading advice

Compare against other stocks

Adani Enterprises
Trading
Add Stock
Add Another

Adani Enterprises Returns Calculator

Ex-date: 12 Jun 2026

Ex-date: 17 Nov 2025

Adani Enterprises Latest News

1 week ago
Adani Enterprises Q2 Results: Net profit falls 55% to ₹1,492 crore, revenue up 75%
3 weeks ago
Adani Enterprises signs MoU with US-based Jabil for data centre hardware JV; shares trade flat
1 month ago
Top gainers and losers, October 8: AEL tumbles 5%, JSW Steel, ITC, Max Healthcare shares fall 4%; check list
1 month ago
Market Wrap, Oct 8: SENSEX plunges 1,045 pts, NIFTY sinks 1.6% as oil tops $104; over ₹10 lakh crore wiped out
1 month ago
SENSEX drops over 300 points, NIFTY50 opens at 22,599; SBI Life, Bajaj Finance down, while IT stocks lead gainers
1 month ago
NALCO, Vedanta, Hindalco, others drag Nifty Metal: How did metal stocks perform on October 7?
1 month ago
Top gainers and losers, September 29: Titan, Wipro shares fall 3%, Adani Enterprises surges 5%; check list
1 month ago
SENSEX, NIFTY50 plunge, NIFTY Bank drops over 1,000 pts; 5 factors behind Monday’s market crash
1 month ago
Top gainers and losers, September 28: Tata Motors PV, AEL, Jio Financials tumble 3%; Dr. Reddy’s up 2%
1 month ago
Adani Enterprises shares rise after ₹2,498 crore block deal; what investors should know
Showing news item 1 of 10

Adani Enterprises Share Price FAQs


Please be aware that Adani Enterprises stock prices are subject to continuous fluctuations due to various factors.