
Solar Industries (India) Share Price
NSE: SOLARINDS
|BSE: 532725
|Chemicals
₹16,850.00
+₹198.00 (1.19%) Last updated on 13 Jun, 2025 | 15:59 ISTSolar Industries (India) Overview
Market cap | Open ₹16,452.00 | Prev. Close ₹16,652.00 |
Circuit range ₹18,535.00 - ₹15,165.00 | Day range ₹16,055.00 - ₹16,921.00 | Year range ₹8,482.50 - ₹17,129.00 |
Volume 1,46,409 | Avg. traded ₹16,776.44 | Revenue (12m) ₹7,550 Crs |
About Solar Industries (India)
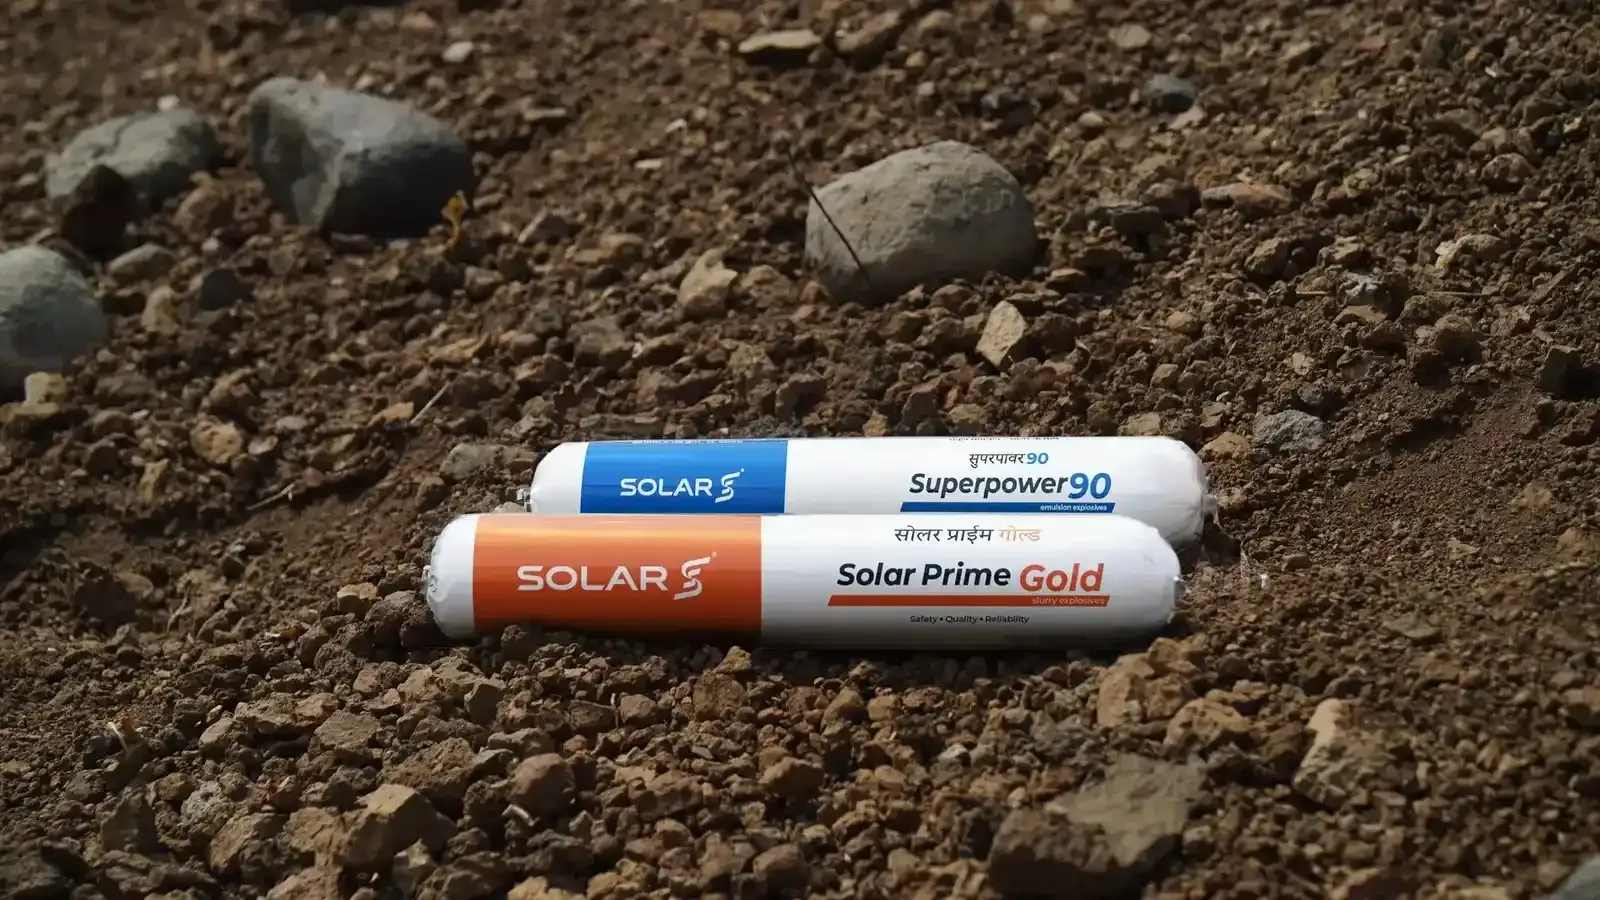
Solar Industries India Limited is an India-based integrated global explosives company. The Company is primarily involved in the manufacturing of complete range of industrial explosives and explosive initiating devices. Its segment is Explosives and its accessories. The Company's products include industrial explosives and defense. Its industrial explosives products include packaged emulsion explosives, bulk explosives and explosive initiating systems. Its industrial explosives include superpower 90, solargel, solar prime, solar prime gold, Eco Power, and others. The Company's defense products include high energy materials, such as HMX, RDX, TNT and their compounds; composite propellants for Pinaka, Akash, Brahmos, PSOMXL and Skyroot, among others; 30 mm ammunition, multi-mode hand grenade, mines, warheads, bund blasting device; artillery fuses, ASW fuses, Pyros and igniters; chaff payloads; loitering munition; rocket integration, and explosives filling of ammunition.
Solar Industries (India) Share Price Chart
Please wait...
Solar Industries (India) Key Indicators
P/E ratio 126.07 | P/B ratio 35.12 | ROE 28.99% |
ROCE 34.23% | Dividend yield 0.06% | Debt/Equity ratio 0.13 |
EPS 65.89 |
Investment Checklist: (4/6)
Equity returns
Dividend returns
Safety factor
Growth factor
Debt vs Equity
Profit factor
The investment checklist helps you understand a company's financial health at a glance and identify quality investment opportunities easily
Analyst Ratings:
83%
Hold
17%
Sell
0%
This analysis is based on the reviews of 6 experts in the last 7 days
Solar Industries (India) Financial Ratios
Operating profit margin23.76% | Net profit margin15.86% |
ROE28.99% | ROA19.86% |
ROCE34.23% |
Quick ratio2.03 | Current ratio2.5 |
Interest coverage28.05 | Asset turnover1.25 |
Debt to Equity0.13 |
P/E ratio126.07 | P/B ratio35.12 |
EV / EBITDA89.32 | |
Dividend yield0.06% |
Revenue Statement
All values are in ₹ Crores (Cr)
Year | Revenue | Operating Profit | Net Profit |
---|---|---|---|
Mar-24 | ₹6,069.52 | ₹1,413.68 | ₹875.23 |
Mar-23 | ₹6,922.53 | ₹1,320.44 | ₹811.17 |
Mar-22 | ₹3,947.61 | ₹766.92 | ₹455.47 |
Mar-21 | ₹2,515.63 | ₹536.02 | ₹288.07 |
Cash Flow
All values are in ₹ Crores (Cr)
Year | Operating | Investing | Financing |
---|---|---|---|
Mar-24 | ₹-726.46 | ₹-370.28 | |
Mar-23 | ₹-518.97 | ||
Mar-22 | ₹-303.05 | ₹-45.40 | |
Mar-21 | ₹-250.74 | ₹-26.07 |
Balance Sheet
All values are in ₹ Crores (Cr)
Period | Total Asset | Total Liability |
---|---|---|
Mar-24 | ₹5,577.04 | ₹2,149.79 |
Mar-23 | ₹4,908.74 | ₹2,158.04 |
Mar-22 | ₹3,629.42 | ₹1,614.51 |
Mar-21 | ₹2,959.42 | ₹1,317.32 |
Solar Industries (India) Share Price History
Day | Open | Close | Change % |
---|---|---|---|
13-Jun-25 | ₹16,452.00 | ₹16,850.00 | |
12-Jun-25 | ₹16,650.00 | ₹16,652.00 | |
11-Jun-25 | ₹16,949.00 | ₹16,587.00 | -1.89% |
10-Jun-25 | ₹16,899.00 | ₹16,907.00 | |
09-Jun-25 | ₹16,599.00 | ₹16,827.00 | |
06-Jun-25 | ₹17,073.00 | ₹16,523.00 | -2.94% |
05-Jun-25 | ₹16,890.00 | ₹17,023.00 | |
04-Jun-25 | ₹16,700.00 | ₹16,809.00 |
Corporate Actions
Dividend • ₹8.5/share
Ex date 04 Jul 2024
Solar Industries (India) Futures & Options
Expiry dates | Current price | Change % |
---|---|---|
SOLARINDS 17000 CE 26 JUN 25 | ₹319.20 | |
SOLARINDS 18500 CE 26 JUN 25 | ₹30.60 | |
SOLARINDS 18000 CE 26 JUN 25 | ₹70.00 | |
SOLARINDS 16000 PE 26 JUN 25 | ₹110.50 | -₹48.60 (-30.55%) |
View all
Stocks Similar to Solar Industries (India)
Stock Name | Price | Change % |
---|---|---|
Alkyl Amines Chem | ₹1,991.10 | -₹7.50 (-0.38%) |
Atul | ₹6,988.00 | -₹86.00 (-1.22%) |
Clean Science & Tech | ₹1,463.90 | +₹4.40 (0.30%) |
Deepak Nitrite | ₹1,909.90 | -₹20.40 (-1.06%) |
Fine Organic | ₹4,739.00 | -₹63.90 (-1.33%) |
Godrej Industries | ₹1,278.10 | -₹14.40 (-1.11%) |
Gujarat Fluorochemicals | ₹3,727.20 | +₹46.00 (1.25%) |
Navin Fluorine | ₹4,543.90 | +₹13.00 (0.29%) |
Tata Chemicals | ₹925.45 | -₹7.30 (-0.78%) |
Vinati Organics | ₹1,880.80 | -₹1.90 (-0.1%) |
Popular Stocks
Stock Name | Price | Change % |
---|---|---|
BEL | ₹394.20 | +₹6.80 (1.76%) |
CDSL | ₹1,659.70 | +₹15.50 (0.94%) |
HAL | ₹5,026.00 | +₹70.00 (1.41%) |
HDFC Bank | ₹1,917.60 | -₹25.80 (-1.33%) |
Indian Railway Tourism Corp | ₹770.65 | -₹0.65 (-0.08%) |
ITC | ₹413.90 | -₹7.10 (-1.69%) |
JIO FIN SERVICES LTD | ₹294.05 | -₹1.95 (-0.66%) |
Reliance | ₹1,427.90 | -₹13.70 (-0.95%) |
Tata Motors | ₹712.05 | -₹3.30 (-0.46%) |
Tata Power | ₹397.20 | -₹4.45 (-1.11%) |
Solar Industries (India) News
FAQs on Solar Industries (India)
What is the share price of Solar Industries (India) today?
Solar Industries (India) share price is ₹ 16,850.00 as on 13 Jun, 2025 | 15:59 IST.
What are the high & low stock price of Solar Industries (India) today?
Solar Industries (India) stock price hit a high of ₹ 16,921.00 and low of ₹ 16,055.00 as on 13 Jun, 2025 | 15:59 IST.
What is the market cap of Solar Industries (India)?
The market cap of Solar Industries (India) is ₹ 1,52,475.70 Crores as on 13 Jun, 2025 | 15:59 IST.
What are the the 52-week high and low share prices of Solar Industries (India) stock on the NSE?
52-week high stock Price of Solar Industries (India) is ₹ 17,129.00 and Low Price is ₹ 8,482.50 as on 13 Jun, 2025 | 15:59 IST.
What are the stock symbols of Solar Industries (India)?
The stock symbol of Solar Industries (India) is NSE: SOLARINDS on the NSE, BSE: 532725 on the BSE, and the ISIN is INE343H01029.
Can I buy Solar Industries (India) shares on Holidays?
No, shares of Solar Industries (India) or any other publicly traded company cannot be bought or sold on holidays when the stock exchanges are closed. You can only buy or sell Solar Industries (India) shares on days when the stock exchanges are open for trading. It's important to check the NSE & BSE holidays calendar, before placing any trades to avoid any inconvenience.
What is the PE and PB ratio of Solar Industries (India)?
The PE and PB ratio of Solar Industries (India) is 126.07 and 35.12 respectively, as on 13 Jun, 2025 | 15:59 IST.