Tata Steel Limited Background
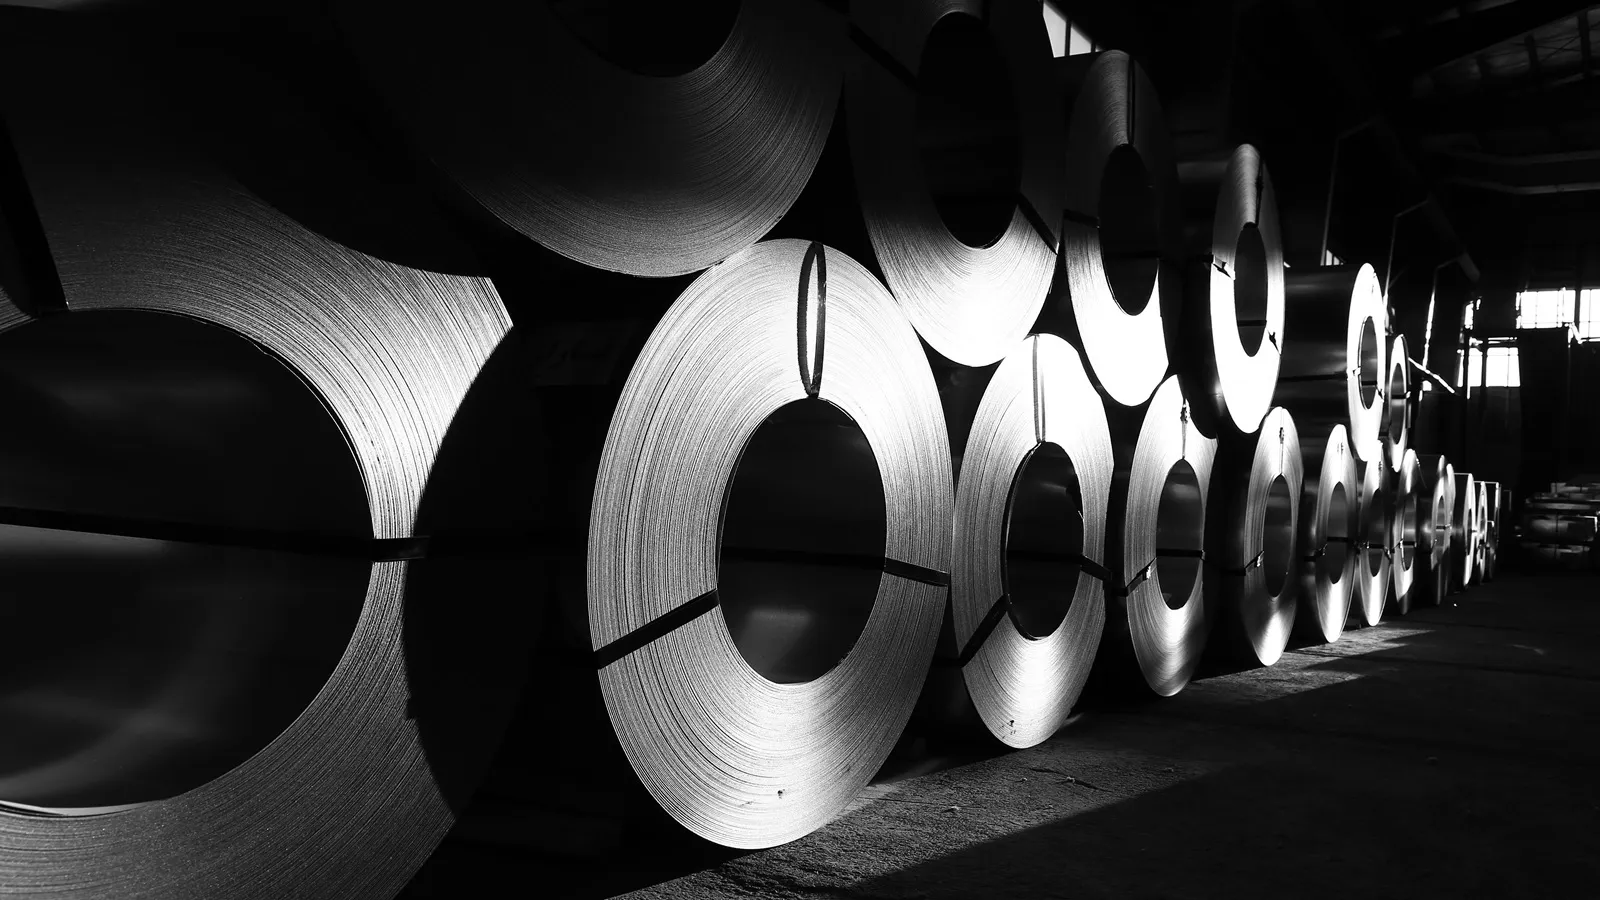
Tata Steel Limited is India's biggest steel producer and one of the oldest companies in the prestigious Tata Group family. Founded way back in 1907, this company has been making steel for over a century. They manufacture everything from the steel sheets that go into the car to the massive beams used in constructing bridges and buildings.
Tata Steel have factories in Europe and Southeast Asia too, with a total capacity of around 34 million tonnes of steel per year. They control the entire process, from digging iron ore out of the ground to delivering finished steel products to customers in over 50 countries. With India building new highways, metro lines and cities, Tata Steel is right in the middle of all that action.
Company Details
- Founded: 1907 (originally called Tata Iron and Steel Company)
- Headquarters: Mumbai, Maharashtra, India
- NSE Symbol: TATASTEEL
- BSE Code: 500470
- ISIN: INE081A01020
- Sector: Basic Materials
- Industry: Steel Manufacturing
Core Business Segments
-
Flat Steel Products – They produce the hot-rolled and cold-rolled sheets. The ones that go into cars, home appliances and construction.
-
Long Steel Products – They produce rails for trains, construction beams and wire rods for building projects
-
Speciality Products - Tata Steel also makes high-end steel products like tubes, bearings and custom steel for specific industries
-
Mining – Integrating backwards, they dig their own iron ore and coal, the two major components of the steel industry. This helps them control costs and frees them from any possible supplier dependency.
-
International Plants – Tata Steel is a multinational company, running factories in the UK, Netherlands and Thailand and thereby serving global markets
Tata Steel Latest News & Corporate Actions
Corporate Developments
-
Port Talbot EAF Construction Begins (July 2025) - Tata Group Chairman N. Chandrasekaran declared on £1.25 billion Electric Arc Furnace (EAF) at Port Talbot in July 2025, with UK Government contributing £500 million. The new EAF is expected to be opertaional by end of 2027 and expected to reduce carbon emissions by 90% (about 5 million tonnes of CO₂ annually) and generating 5,000 jobs.
-
India Expansion Approved - The Board has given approval for a 4.8 MTPA (Million Tonnes Per Annum) capacity expansion at Neelachal Ispat Nigam Limited (NINL). This plant will focus on long products for the retail and construction sectors.
-
Netherlands Operations Restructuring (April 2025) - Tata Steel Nederland announced a major transformation programme involving approximately 1,600 management and support role reductions to enhance competitiveness and efficiency.
-
Strong Stock Performance - Tata Steel shares are up 25% in 2025, showing strong momentum despite sector challenges.
Major Strategic Initiatives
-
Sustainability Recognition - Named 2025 Steel Sustainability Champion by worldsteel for the eighth consecutive year. Also recognised as Gold Employer by India Workplace Equality Index 2025 for fifth consecutive year.
-
Digital Leadership - Recognised with 'Digital Enterprise of India – Steel' Award 2024 by Economic Times CIO.
Market Reaction & Stock Highlights
-
Tata Steel's share price moves up and down quite a bit and it's usually tied to what's happening with steel prices globally. It is commonly observed that when steel prices go up, the stock usually follows and vice versa.
-
The stock is sensitive to what's happening in China (the world's biggest steel consumer) and the costs of its raw materials (iron ore and coal)
-
Investors pay attention to quarterly results, how much debt the company has, and whether the European operations are finally turning profitable.
Other Corporate Actions
- Raw Material Security - Thriveni Pellets acquisition (December 2025) for ₹636 crore strengthens pellet supply chain with 4 MTPA capacity and 212 km pipeline infrastructure in Odisha.
- Tax Litigation - Company finds itself amidst GST demand of ₹1,132+ crore (December 2025). Management confirms this has no material impact on operations or financials.
- Capital Allocation - $150 million investment in T Steel Holdings (December 2025) shows commitment to optimising global structure.
- First All-Women Mining Shift (December 2024) - Made history with India's first-ever all-women shift in an iron ore mine at Noamundi, plus an all-women firefighting crew at Jamshedpur.
- Green Innovations - First Indian steelmaker to introduce biochar (November 2024). First to complete paperless import shipment using Electronic Bill of Lading (July 2025).
- Kalinganagar Milestone (September 2024) - Commissioned India's largest blast furnace at the Kalinganagar plant.
Source – NSE website, BSE announcements, and company investor presentations
Tata Steel Financial Highlights
- Revenue: Tata Steel reported revenue of ₹2,33,541.72 crore in FY26 vs ₹2,20,083.04 crore in FY25. It showed an increase of 6.12% on a yearly basis.
- Operating Profit: Tata Steel reported an operating profit of ₹15,968.69 crore in FY26 vs ₹8,412.87 crore in FY25. It showed an increase of 89.81% on a year-on-year basis.
- Net Profit: Tata Steel reported a net profit of ₹10,885.82 crore in FY26 vs ₹3,173.78 crore in FY25. It showed an increase of 242.99% on a yearly basis.
Tata Steel Quarterly Result Highlights
- Tata Steel reported revenue of ₹61,026.97 crore in Jun 2026, compared with ₹63,518.60 crore in Mar 2026, representing a decrease of 3.92% on a quarter-on-quarter (QoQ) basis.
- Tata Steel reported an operating profit of ₹3,837.53 crore in Jun 2026, compared with ₹4,810.37 crore in Mar 2026, representing a decrease of 20.22% on a quarter-on-quarter (QoQ) basis.
- Tata Steel reported a profit of ₹2,385.24 crore in Jun 2026, compared with ₹2,965.00 crore in Mar 2026, reflecting a decrease of 19.55% on a QoQ basis.
- The earnings per share (EPS) of Tata Steel stood at ₹8.65 during Jun 2026.
Data Source: BSE, Company announcements
Securities shown are illustrative, not recommendations. Past performance does not guarantee future results.