Havells India Ltd is one of India’s largest and fastest-growing electrical equipment companies headquartered in Noida, India. In 1983, Havells India Private Limited was established under the Companies Act of 1956 by Shri Qimat Rai Gupta and Surjit Kumar Gupta. Later on, it became Havells India Limited in 1992.
The company listed its initial public offering (IPO) in 2001. Havells India Ltd. has a total market capitalization of over ₹87,000 crore as of 10 January 2024. Havells India Ltd.’s share price rose by over 38% in the last three years.
Originally, it was a manufacturing company for switchgear items like miniature circuit breakers, MCB distribution boards and fuses at Samaypur Badli, Delhi.
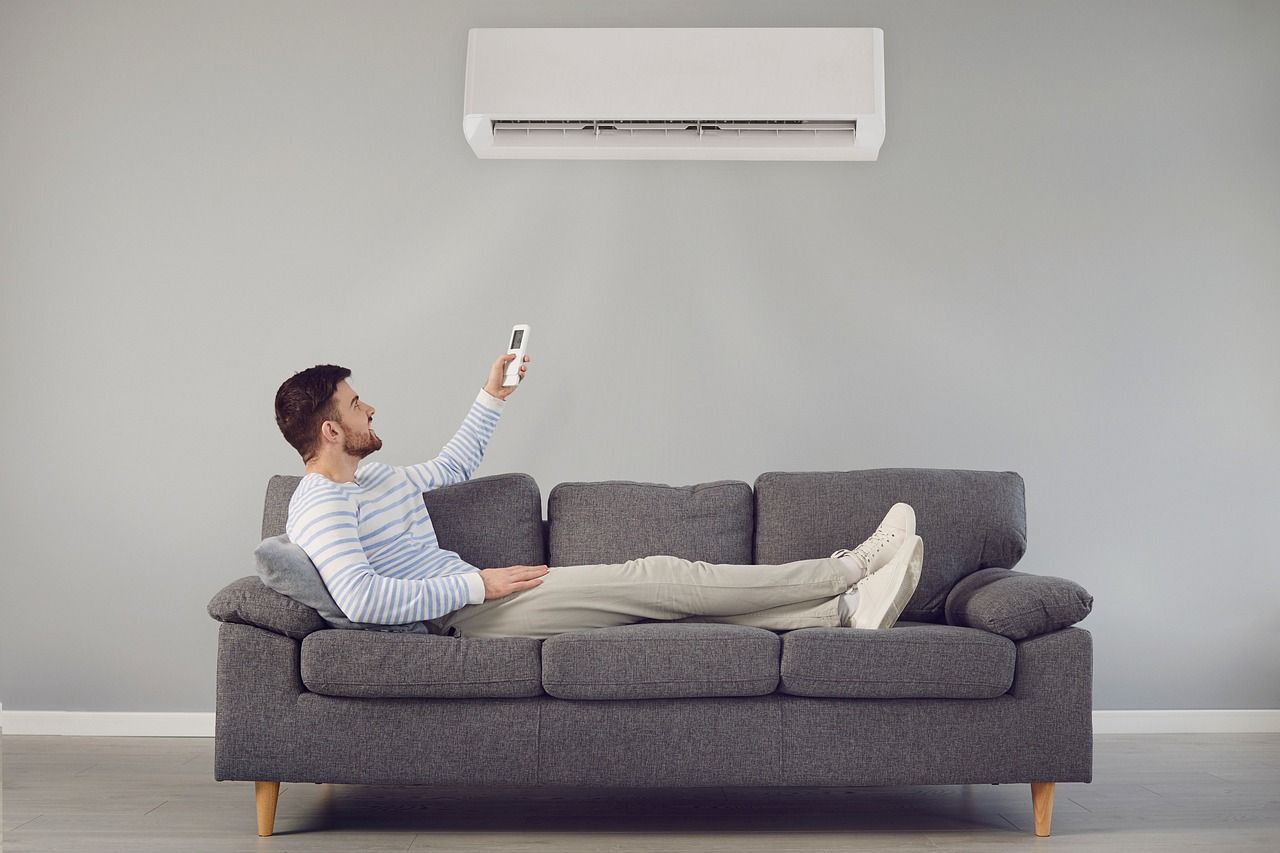
Their product range consists of industrial and domestic circuit protection switchgear, cables and wires, motors, water heaters, fans, power capacitors, CFL lamps and modular switches.
In 1991, the company amalgamated with Elymer Havbell's Pvt. Ltd., which had facilities for manufacturing HRC fuses. Havells also entered into a technical collaboration with M/s Christian Geyer GmbH & Co, Germany for manufacturing miniature circuit breakers in India.
Business Operations
Havells India is a public limited Company domiciled in India with its registered office at K.G. Marg, Connaught Place, New Delhi. The Company is listed on BSE Limited and National Stock Exchange of India Limited.
Havells has 15 manufacturing facilities strategically located in different parts of India. It has a strong network of 17,000+ dealers and 2.22 lakh retailers. The employee strength of Havells is an impressive count of 6,800+. The brand has expanded its business to almost every continent in the world.
The company owns prestigious global brands like Crabtree, Sylvania, Concord, Lumiance & Linolite. They have also taken the initiative to reach directly to the consumers through ‘Havells Galaxy’ - a one-stop shop for all electrical and lighting needs.
The Company has one direct overseas subsidiary, Havells Guangzhou International Limited, based in China.
For Havells, the financial year 2022-23 was the first year after Covid disruptions with a stable business environment, though disruptions in the global supply chain and geopolitical tension have led to a steep run-up in commodity prices. The impact of the same was witnessed on the company margins as the entire cost escalation could not be passed on to the customers.
Financials highlights
The company’s profit was at ₹1,075 crore in FY23 as against ₹1,195 crores in FY22.
Total revenue increased to ₹16,911 crore in FY23 from ₹13,938 crore in FY22.
Consolidated profit after tax (PAT) reduced by 10.4% year-on-year to ₹1,072 crore in FY23 from ₹1,196 crore in FY22.
The earnings per share for FY23 was Rs 17.1 as compared to the EPS of FY22 at Rs 19.1.
Consolidated EBITDA (earnings before interest, taxes, depreciation, and amortisation) decreased to ₹1,777 crore in FY23 from ₹1,921 crore in FY22.
Havells India Financial Highlights
- Revenue: Havells India reported revenue of ₹23,022.16 crore in FY26 vs ₹22,081.33 crore in FY25. It showed an increase of 4.26% on a yearly basis.
- Operating Profit: Havells India reported an operating profit of ₹2,209.57 crore in FY26 vs ₹1,990.49 crore in FY25. It showed an increase of 11.01% on a year-on-year basis.
- Net Profit: Havells India reported a net profit of ₹1,689.25 crore in FY26 vs ₹1,470.24 crore in FY25. It showed an increase of 14.90% on a yearly basis.
Havells India Quarterly Result Highlights
- Havells India reported revenue of ₹7,001.45 crore in Mar 2026, compared with ₹5,630.59 crore in Dec 2025, representing an increase of 24.35% on a quarter-on-quarter (QoQ) basis.
- Havells India reported an operating profit of ₹917.61 crore in Mar 2026, compared with ₹407.62 crore in Dec 2025, representing an increase of 125.11% on a quarter-on-quarter (QoQ) basis.
- Havells India reported a profit of ₹723.39 crore in Mar 2026, compared with ₹300.05 crore in Dec 2025, reflecting an increase of 141.09% on a QoQ basis.
- The earnings per share (EPS) of Havells India stood at ₹26.95 during Mar 2026.