The current prices are delayed, login to your account for live prices
Login
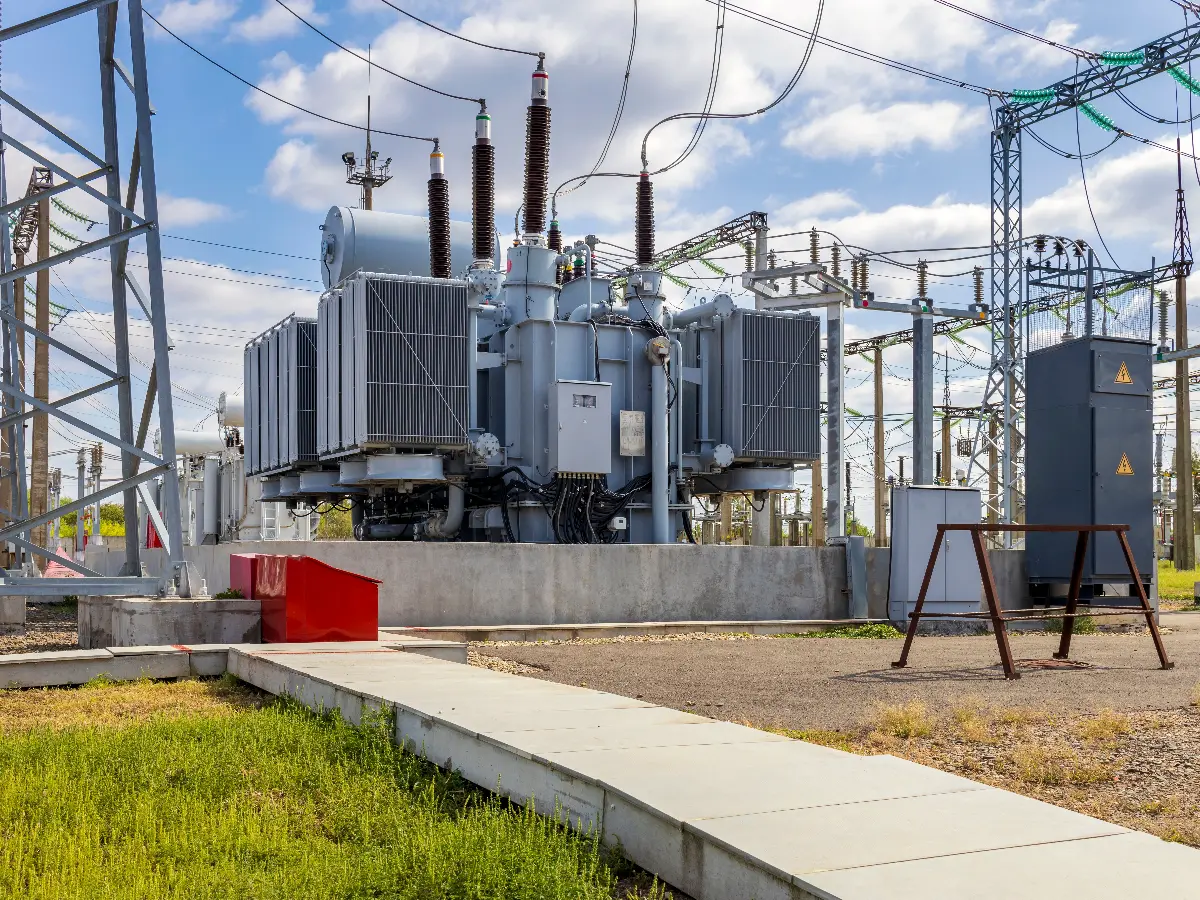
GE T&D India Share Price
GVT&D
₹ 5,052.50
-₹351.50 (-6.5%)
1D
Last updated 24 Jun, 2026, 15:57 IST
by SEBI experts available for this stock
Earn more using advisory

₹5,000.00
6.50% down today
₹5,379.00
1D LOW1D HIGH
News related to GE T&D India


FAQs on GE T&D India
What is the share price of GE T&D India today?
What are the high & low stock price of GE T&D India today?
What is the market cap of GE T&D India?
What are the upper & lower circuit limits of GE T&D India shares today on NSE & BSE?
What was yesterday's closing price for GE T&D India shares on the NSE & BSE?
What are the the 52-week high and low share prices of GE T&D India stock on the NSE?
What are the stock symbols of GE T&D India?
How to buy GE T&D India shares?
Can I buy GE T&D India shares on Holidays?
What is the PE and PB ratio of GE T&D India?