Shree Renuka Sugars Share Price
Shree Renuka Sugars Share Price Today
As of 26 Jul 2026, Shree Renuka Sugars share price is ₹22.23. The stock opened at ₹21.65, compared to its previous close of ₹21.68. During today's trading session, Shree Renuka Sugars share price moved in the range of ₹21.50 to ₹22.40, with an average price of ₹21.95 for the day. Looking at its last 52-week, the stock has touched a low of ₹21.05 and a high of ₹33.50. On the performance front, Shree Renuka Sugars share price has declined by 3.56% over the last six months and is down 29.32% on a year-on-year basis.
Shree Renuka Sugars Returns Calculator
Shree Renuka Sugars Shareholder Returns
Shree Renuka Sugars Share Price History
| Name | Mkt Cap Cr | P/E | P/B | ROE | D/E | ROCE | Book Value | Div. Yield | Turnover | EPS(TTM) |
|---|---|---|---|---|---|---|---|---|---|---|
| Eid Parry India | 13,485.50 | 24.22 | 1.56 | 19.02% | 0.59 | 25.03% | 7.36 | 0.00% | 1.49 | -39.83 |
| Balrampur Chini Mills | 12,890.50 | 34.07 | 2.81 | 9.15% | 0.81 | 8.72% | 205.54 | 0.55% | 1.23 | 17.19 |
| Triveni Engineering & Industries | 5,503.57 | 20.49 | 1.65 | 8.04% | 0.63 | 8.38% | 150.69 | 0.50% | 2.00 | 11.73 |
| Bannari Amman Sugars | 4,391.15 | 29.69 | 2.29 | 7.73% | 0.00 | 9.33% | 1,525.87 | 0.36% | 0.94 | 117.96 |
| Bajaj Hindusthan Sugar | 4,126.29 | 32.57 | 1.08 | 3.69% | 0.91 | 2.34% | 16.00 | 0.00% | 0.68 | 1.01 |
| Dalmia Bharat Sug In | 2,939.31 | 13.51 | 0.99 | 7.47% | 0.44 | 8.29% | 0.99 | 0.00% | 0.92 | 29.38 |
| M.V.K. AGRO FOOD PROD LTD | 1,958.04 | 42.00 | 4.35 | 10.35% | 0.53 | 9.06% | 81.92 | 0.00% | 0.26 | 3.31 |
| GODAVARI BIOREFINERIES L | 1,425.00 | 403.55 | 1.81 | 4.27% | 0.68 | 6.38% | 151.05 | 0.00% | 1.69 | 0.24 |
| Avadh Sug & Energy | 1,060.88 | 16.38 | 0.83 | 5.15% | 1.25 | 6.49% | 0.83 | 2.13% | 1.72 | 28.63 |
| Dhampur Sugar Mills | 913.80 | 13.99 | 0.76 | 5.44% | 0.75 | 6.42% | 185.23 | 1.41% | 1.92 | 9.93 |
Shree Renuka Sugars Financials
Income Statement · Consolidated
| Particulars | Mar 2025 | Mar 2024 | Mar 2023 | Mar 2022 |
|---|---|---|---|---|
| Revenue | ₹10,914.27 | ₹11,327.60 | ₹9,020.75 | ₹6,432.63 |
| Other Income | ₹126.63 | ₹39.80 | ₹85.79 | ₹69.01 |
| Total Revenue | ₹11,040.90 | ₹11,367.40 | ₹9,106.54 | ₹6,501.64 |
| Total Expenses | ₹11,403.52 | ₹11,829.21 | ₹9,286.10 | ₹6,640.21 |
| Profit Before Tax | -₹362.62 | -₹461.81 | -₹179.57 | -₹138.57 |
| Tax | -₹62.75 | ₹165.39 | ₹17.10 | -₹1.85 |
| Profit After Tax | -₹299.87 | -₹627.19 | -₹196.67 | -₹136.72 |
| EPS - Basic | -₹1.41 | -₹2.95 | -₹0.93 | -₹0.65 |
| EPS - Diluted | -₹1.41 | -₹2.95 | -₹0.93 | -₹0.65 |
Cash Flow · Consolidated
| Particulars | Mar 2025 | Mar 2024 | Mar 2023 | Mar 2022 |
|---|---|---|---|---|
| Profit before tax | -₹362.62 | -₹461.81 | -₹179.57 | -₹138.57 |
| Income before WC changes | ₹708.75 | ₹766.62 | ₹637.40 | ₹476.66 |
| Change in Assets | ₹1,293.76 | -₹2,510.48 | -₹266.77 | ₹245.09 |
| Change in Liabilities | -₹1,041.40 | ₹2,664.28 | ₹559.95 | -₹851.74 |
| Change in WC | ₹252.36 | ₹153.80 | ₹293.18 | -₹606.64 |
| Cash flow from Operations | ₹950.43 | ₹913.36 | ₹926.42 | -₹133.70 |
| Cash flow from Investing | -₹184.71 | -₹380.19 | -₹354.42 | -₹302.09 |
| Cash flow from Financing | -₹709.65 | -₹669.16 | -₹331.58 | ₹454.48 |
| Total Cash Flow | ₹56.07 | -₹136.00 | ₹240.43 | -₹16.39 |
| Cash (Start of the year) | ₹37.87 | ₹167.03 | ₹22.23 | ₹38.63 |
| Cash (End of the year) | ₹62.68 | ₹37.87 | ₹167.03 | ₹22.23 |
Balance Sheet · Consolidated
| Particulars | Mar 2025 | Mar 2024 | Mar 2023 | Mar 2022 |
|---|---|---|---|---|
| Non-Current Assets | ₹4,657.57 | ₹4,745.50 | ₹4,548.39 | ₹4,369.36 |
| Current Assets | ₹4,180.05 | ₹5,425.43 | ₹3,055.79 | ₹2,734.01 |
| Total Assets | ₹8,837.62 | ₹10,170.93 | ₹7,604.18 | ₹7,103.37 |
| Current Liabilities | ₹7,079.38 | ₹7,988.23 | ₹5,198.78 | ₹4,751.25 |
| Net Current Asset | -₹2,899.34 | -₹2,562.80 | -₹2,142.99 | -₹2,017.24 |
| Non-Current Liabilities | ₹3,433.42 | ₹3,620.02 | ₹3,286.05 | ₹2,959.58 |
| Equity Capital | -₹1,675.19 | -₹1,437.33 | -₹880.64 | -₹607.46 |
| Total Equity & Liabilities | ₹8,837.62 | ₹10,170.93 | ₹7,604.18 | ₹7,103.37 |
Income Statement · Standalone
| Particulars | Mar 2025 | Mar 2024 | Mar 2023 | Mar 2022 |
|---|---|---|---|---|
| Revenue | ₹10,279.44 | ₹10,841.31 | ₹8,578.14 | ₹6,125.94 |
| Other Income | ₹144.57 | ₹56.77 | ₹108.03 | ₹83.20 |
| Total Revenue | ₹10,424.01 | ₹10,898.08 | ₹8,686.17 | ₹6,209.14 |
| Total Expenses | ₹10,727.62 | ₹11,291.61 | ₹8,808.89 | ₹6,339.08 |
| Profit Before Tax | -₹303.61 | -₹393.53 | -₹122.71 | ₹121.45 |
| Tax | -₹47.76 | ₹165.98 | ₹13.02 | ₹8.39 |
| Profit After Tax | -₹255.85 | -₹559.51 | -₹135.73 | ₹113.07 |
| EPS - Basic | -₹1.20 | -₹2.63 | -₹0.64 | ₹0.53 |
| EPS - Diluted | -₹1.20 | -₹2.63 | -₹0.64 | ₹0.53 |
Cash Flow · Standalone
| Particulars | Mar 2025 | Mar 2024 | Mar 2023 | Mar 2022 |
|---|---|---|---|---|
| Profit before tax | -₹303.61 | -₹393.53 | -₹122.71 | ₹121.45 |
| Income before WC changes | ₹650.49 | ₹724.60 | ₹607.29 | ₹445.52 |
| Change in Assets | ₹1,190.97 | -₹2,305.99 | -₹240.06 | ₹628.77 |
| Change in Liabilities | -₹895.74 | ₹2,695.97 | ₹492.84 | -₹864.69 |
| Change in WC | ₹295.24 | ₹389.98 | ₹252.78 | -₹235.92 |
| Cash flow from Operations | ₹943.33 | ₹1,114.43 | ₹856.65 | ₹206.31 |
| Cash flow from Investing | -₹87.49 | -₹553.83 | -₹344.74 | -₹248.70 |
| Cash flow from Financing | -₹838.96 | -₹601.27 | -₹453.14 | ₹31.61 |
| Total Cash Flow | ₹16.88 | -₹40.66 | ₹58.77 | -₹10.78 |
| Cash (Start of the year) | ₹29.50 | ₹70.15 | ₹11.39 | ₹22.16 |
| Cash (End of the year) | ₹46.58 | ₹29.50 | ₹70.15 | ₹11.39 |
Balance Sheet · Standalone
| Particulars | Mar 2025 | Mar 2024 | Mar 2023 | Mar 2022 |
|---|---|---|---|---|
| Non-Current Assets | ₹4,793.28 | ₹4,932.66 | ₹4,637.05 | ₹4,464.32 |
| Current Assets | ₹3,866.97 | ₹5,016.07 | ₹2,857.35 | ₹2,612.59 |
| Total Assets | ₹8,660.25 | ₹9,948.74 | ₹7,494.40 | ₹7,076.92 |
| Current Liabilities | ₹5,639.33 | ₹6,501.94 | ₹3,806.80 | ₹3,578.18 |
| Net Current Asset | -₹1,772.37 | -₹1,485.87 | -₹949.45 | -₹965.59 |
| Non-Current Liabilities | ₹3,411.42 | ₹3,592.47 | ₹3,274.95 | ₹2,951.75 |
| Equity Capital | -₹390.50 | -₹145.68 | ₹412.65 | ₹546.98 |
| Total Equity & Liabilities | ₹8,660.25 | ₹9,948.74 | ₹7,494.40 | ₹7,076.92 |
About Shree Renuka Sugars
Shree Renuka Sugars Limited is a leading agribusiness and bio-energy company. It is engaged in production and supply of sugar, power and ethanol. It was founded by Narendra Murkumbi and Vidya Murkumbi in 1998.
The company is one of India's major producers of sugar and green energy. Shree Renuka Sugars owns popular sugar brand Madhur and caters to the markets in Europe and Africa. It also produces ethanol and bio fertilisers.
The market capitalisation of Shree Renuka Sugars Limited stood at over ₹10,000 crore as of December 16, 2023. Renuka Sugars share price has gained over 290% in the last three years.
Business operations
Renuka Sugars runs cutting-edge sugar mills, several of which are equipped with ethanol and power cogeneration facilities. It also manages two of India's largest refineries situated at the ports.

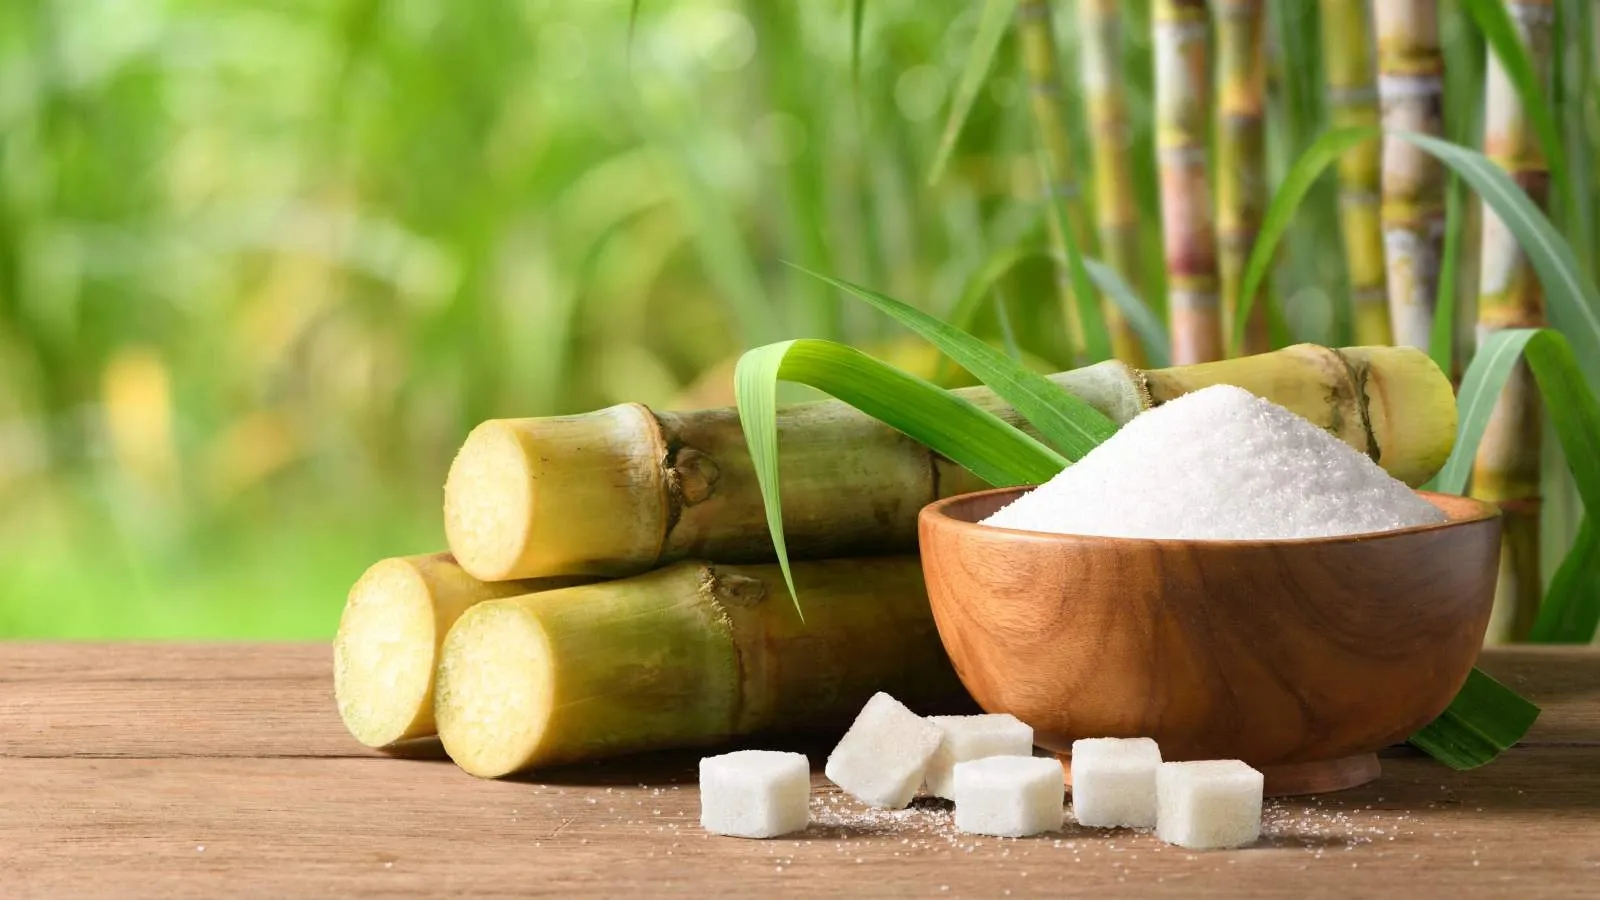
Shree Renuka Sugars Ltd has eight sugar mills in the sugarcane-rich regions of Uttar Pradesh, Maharashtra and Karnataka. Madhur, owned by Renuka Sugars, has become one of India’s top-selling packaged sugar brands since its inception in 2007. It holds a dominant position with a 33% market share in the packaged sugar segment.
Renuka Sugars is one of India's largest exporters of refined sugar, handling over 1.38 million metric tons of raw sugar at its advanced refineries. The white refined sugar is exported to international markets such as the Middle East, North Africa, East Africa and more. The company’s total sugar production in FY 2022-23 stood at 431,167 MT.
Renuka Sugars is one of the largest green bio-energy producers in India. Renuka's green energy division includes ethanol production, utilised for blending with petrol and electricity generation. The company is a major contributor to the Government of India's Ethanol blending program.
Shree Renuka Sugars Ltd has nearly doubled its ethanol production capacities from 720 kilolitres per day to 1,250 kilolitres per day. For its operations, the company uses more than 75% of power derived from renewable sources. It produces three grades of ethanol— absolute alcohol, extra neutral alcohol and rectified spirit.
Renuka Sugars also generates power from bagasse, a sugarcane byproduct. It constitutes renewable energy which cuts down greenhouse gas emissions. This renewable energy powers the company's distilleries and mills. The excess electricity is sold through government grids.
The company is also a major player in the engineering, procurement, and construction (EPC) segment. KBK Chem-Engineering Private Limited is a wholly-owned subsidiary of Shree Renuka Sugars Limited. It specialises in offering high-end EPC solutions for fermentation and distillation industries. It has a strong foothold across Asian, Southeast Asian and African countries. It has succeeded in establishing EPC plants across three continents. KBK specialises in projects within the ethanol and distillery sectors.
Shree Renuka Sugars Financial Highlights
- Revenue: Shree Renuka Sugars reported revenue of ₹9,305.30 crore in FY26 vs ₹11,040.90 crore in FY25. It showed a decrease of 15.72% on a yearly basis.
- Operating Profit: Shree Renuka Sugars reported an operating loss of ₹872.30 crore in FY26 vs ₹362.60 crore in FY25. It showed a decrease of 140.57% on a year-on-year basis.
- Net Profit: Shree Renuka Sugars reported a net loss of ₹792.40 crore in FY26 vs ₹299.90 crore in FY25. It showed a decrease of 164.22% on a yearly basis.
Shree Renuka Sugars Quarterly Result Highlights
- Shree Renuka Sugars reported revenue of ₹2,610.70 crore in Mar 2026, compared with ₹2,300.20 crore in Dec 2025, representing an increase of 13.50% on a quarter-on-quarter (QoQ) basis.
- Shree Renuka Sugars reported an operating loss of ₹153.20 crore in Mar 2026, compared with ₹23.60 crore in Dec 2025, representing a decrease of 749.15% on a quarter-on-quarter (QoQ) basis.
- Shree Renuka Sugars reported a loss of ₹121.40 crore in Mar 2026, compared with ₹38.10 crore in Dec 2025, reflecting a decrease of 218.64% on a QoQ basis.
- The earnings per share (EPS) of Shree Renuka Sugars stood at ₹1.41 during Mar 2026.
Similar Stocks
FAQs on Shree Renuka Sugars Share Price
What is Shree Renuka Sugars share price today?
Shree Renuka Sugars share price is ₹22.23 as on 24 Jul, 2026, 15:40 IST.
How has the Shree Renuka Sugars share price performed in the past?
In the last 1 year, Shree Renuka Sugars delivered a return of -29.32%. The Shree Renuka Sugars share price hit a high of ₹33.50 and low of ₹21.05.
How much is the Mutual Fund shareholding in Shree Renuka Sugars shares?
The Mutual Fund Shareholding in Shree Renuka Sugars was 0.10% at the end of Jun 2026.
What is the the 52-week high and low of Shree Renuka Sugars shares ?
The 52-week high and low of Shree Renuka Sugars share is ₹33.50 and ₹21.05 as of 24 Jul, 2026.
What is the market cap of Shree Renuka Sugars?
The market capitalisation of Shree Renuka Sugars is ₹4,720.99 Crores as on 24 Jul, 2026.
What are the stock symbols of Shree Renuka Sugars?
The stock symbol of Shree Renuka Sugars is RENUKA on the NSE, 532670 on the BSE, and the ISIN is INE087H01022.
How to buy Shree Renuka Sugars shares?
To buy Shree Renuka Sugars shares, open a demat account with Upstox and complete the KYC process. Once your account is set up, search for the stock and place your order.
What was yesterday's closing price of Shree Renuka Sugars shares ?
Shree Renuka Sugars shares closed yesterday at ₹21.68 on NSE & ₹21.70 on BSE
Can I buy Shree Renuka Sugars shares on Holidays?
No, shares of Shree Renuka Sugars or any other publicly traded company cannot be bought or sold on holidays when the stock exchanges are closed. You can only buy or sell Shree Renuka Sugars shares on days when the stock exchanges are open for trading. It's important to check the NSE & BSE holidays calendar, before placing any trades to avoid any inconvenience.