Basics of Options
Payoff and Profit Diagram
Introduction
In an earlier chapter, we had discussed intrinsic value and time value. Intrinsic value is based on the relation of the underlying stock or index price with the strike price. For call options, if the underlying price is above the strike price, then the call option has intrinsic value. For put options, if the underlying price is below the strike price, then the put option has intrinsic value.
In terms of time value, the option will have a time value up until the market closes on its expiration date. Once an option has expired and time value has dropped to zero, it will either have intrinsic value or be worthless.
Since intrinsic value is based on underlying price and strike price, we can create a visualization of all possible financial outcomes. These are commonly known as payoff diagrams.
Why chart a payoff or profit diagram?
It’s simple - chart a payoff diagram to visualize how your strategy could potentially pan out. Draw a profit chart to estimate risk or reward in executing the trade. After all, as the quote goes - The man who is prepared has half his battle fought.
How do you plot the payoff diagram for Call options?
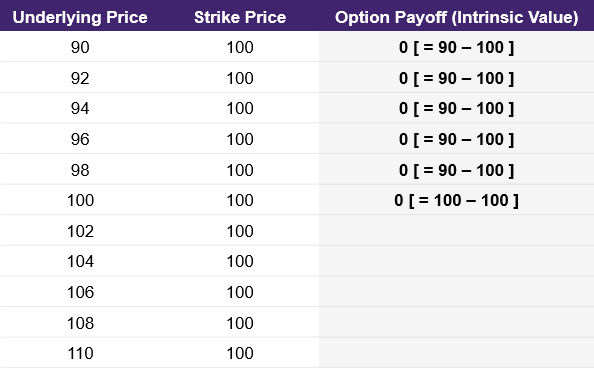
In the table below, we list an increasing hypothetical underlying price. We also list a strike price. As discussed previously, the intrinsic value of a call option is the underlying price minus the strike price.
However, the intrinsic value for a purchased call option cannot be less than zero. This goes back to the definition of a call option: the right but not the obligation to purchase the underlying at a specific price. Since we don’t have the obligation to purchase the underlying at the strike price, we would never do that if the strike price is more than the underlying. Therefore, the intrinsic value for the call option where the underlying price is equal to or less than the strike price will be zero. This is shown in illustration 1 below.
Illustration 1
 Source: Upstox
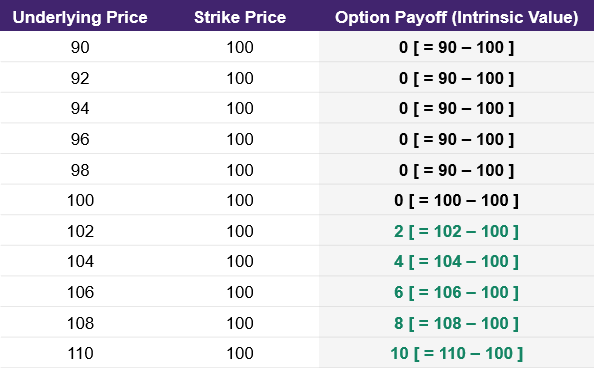
In illustration 2, we expand our table to include situations where the underlying price is above the strike price.
Illustration 2
 Source: Upstox
Since the option payoff or intrinsic value of a purchased call option cannot go below zero, the payoff formula is a conditional formula. Specifically, the payoff formula for a purchased call option is shown below.
Key Formula:
- Call Option Payoff = Max(Underlying Price – Strike Price, 0)
This formula means that you take the maximum of the difference between the underlying price and strike price or 0. While this is the payoff for a call option at expiration, this will also tell you the intrinsic value of the option at any point prior to expiry.
If you calculate the payoff for a range of possible underlying prices that are above and below the strike price, you can plot them as a chart. Below is the payoff diagram of a purchased, or long, call option.
Illustration 3
 Source: Upstox
How do you plot the payoff diagram for Put options?
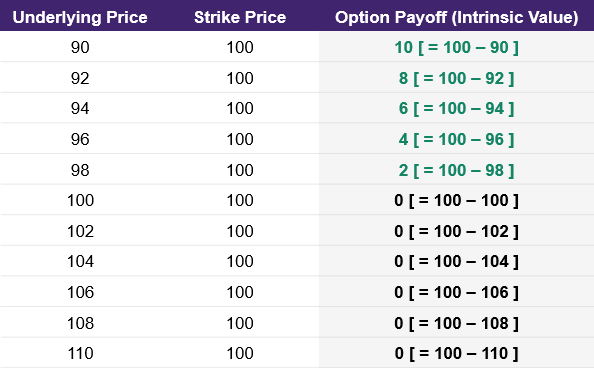
How do you plot the payoff diagram for Put options? For put options, we need to use a slightly modified formula to determine the intrinsic value at various underlying prices. To calculate the put option payoff, we subtract the underlying price from the strike price.
As seen below in illustration 4, when the underlying price is higher than the strike price, the intrinsic value is zero. As a reminder, put options give us the right, but not the obligation, to sell the underlying at a specified price. If we could sell an index or stock at a higher price than the strike price, we would instead just sell on the open market rather than sell at the lower strike price.
As a result, the payoff formula for a purchased put option is:
Key Formula:
- Put Option Payoff = Max(Strike Price – Underlying Price, 0)
This formula means that you take the maximum difference between the strike price and underlying price or zero.
Illustration 4
 Source: Upstox
As we plot the underlying price with the calculated payoff, we get the following payoff diagram shown in illustration 5 below.
Illustration 5
 Source: Upstox
What is an option profit diagram?
One last concept we will introduce in this chapter is the profit diagram. The payoff diagrams that we’ve shown only account for the intrinsic value of the option or the relationship between underlying price at expiration and the strike price. What we haven’t discussed is the cost to purchase this option. Once we account for this cost, the payoff diagram can be seen as a profit diagram.
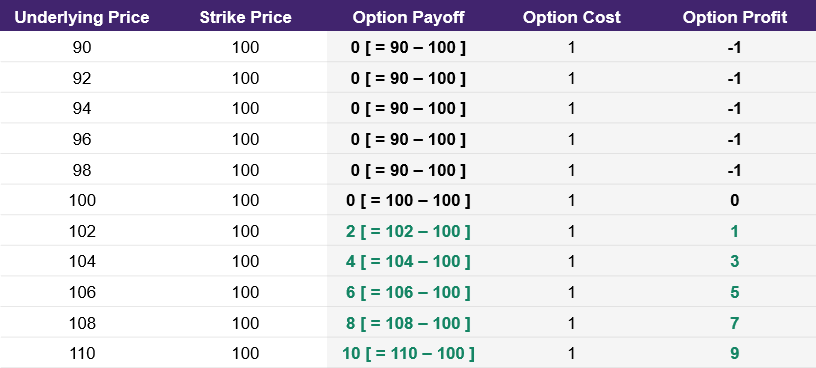
Going back to the call option example, the option payoff is zero whenever the underlying price of 100 equals the strike price of 100. In illustration 6 below, we add additional columns for the option cost and the option profit. We are assuming that this call option cost us 1 to purchase. When the option payoff is less than the cost to purchase the option, then the profit of the trade will be negative. For example, if the underlying price at expiration is 98, then the payoff of the call option will be 0. Since it costs 1 to buy the option, your profit is -1. As seen in the table below, the most you can lose is 1 which is the cost to buy the option.
Illustration 6
 Source: Upstox
In the table, we highlight the row where the underlying price at expiration is 101. This is the break-even price or break-even point.
It is the break-even point because when you subtract the cost to buy the option from the option’s payoff, you get a profit of 0. For a call option, if the underlying price is higher than 101 at expiration, then you will end up with a profit from this option’s trade.
In the chart below, we highlight the subtle difference between the payoff diagram for the call option and incorporating the option’s cost to get to the profit diagram. When you plot the profit diagram, you can also easily visualise the break-even price.
Illustration 7
 Source: Upstox
One last consideration is that we are only discussing the costs associated with purchasing an option to calculate profit. Brokerages charge commissions as well as mandatory exchange fees for each transaction. Traders need to also consider these as part of their individual profit calculation.
Summary
- Use a Payoff diagram to visualize all possible financial outcomes of a strategy.
- For call options, plot payoff diagram using strike price, an increasing underlying price and the corresponding intrinsic value. • For put options, plot payoff diagram using strike price, a decreasing underlying price and the corresponding intrinsic value.
- Include cost to purchase the option in the payoff diagram to plot a profit diagram.
- A profit diagram helps you visualize the break-even price, or the point at which the trade turns profitable.
Is this chapter helpful?
- Home/
- Payoff and Profit Diagram