Volatility and The Option Greeks
Volatility and The Greeks
Volatility and the Greeks
When you’re in the market for a used car, you want to get a great deal; a vehicle that offers good value for the price you pay. You will do some research on this car by looking at different manufacturers and models. You will read up on features, reliability, and customer reviews. Once you have narrowed in on a particular model, you will try to find one with the best combination of mileage, condition, maintenance history, and included options – and all for the best price.
This research and comparison shopping is likely something you are familiar with, whether it is for a car or any other large purchase. In fact, you may even be familiar with this concept in the investment world. When you invest in mutual funds, you want to find the best fund manager with a great track record and low fees. When you invest or trade in individual stocks, you want to successfully buy-low-and-sell-high. In order to buy low, you need to get a great deal on that stock when you enter into the position.
When you trade options, you also want to buy-low-and-sell-high, but doing so requires learning about some new topics – topics that we will explore in “Volatility and the Greeks”.
In this next options trading course, we will build on the ‘Introduction to Options’ course and expand into two key topics – volatility and option Greeks. We will take some of the learnings in the prior course and build on those. At this point, you should be comfortable answering these questions before undertaking this course on ‘Volatility and the Greeks’:
- Why would you want to trade options?
- What are call and put options?
- What is the difference between going long and going short an option?
- What are parts of an options contract – underlying strike price, expiration date?
- What is intrinsic value and extrinsic (time) value?
Illustration 1 below is a screenshot of the Upstox option chain. In blue, we have highlighted sections that include data points that we have yet to discuss. These are implied volatility, delta, theta, vega, and gamma. We will provide you an introduction to these terms and how you can use them to become a better trader.
Illustration 1
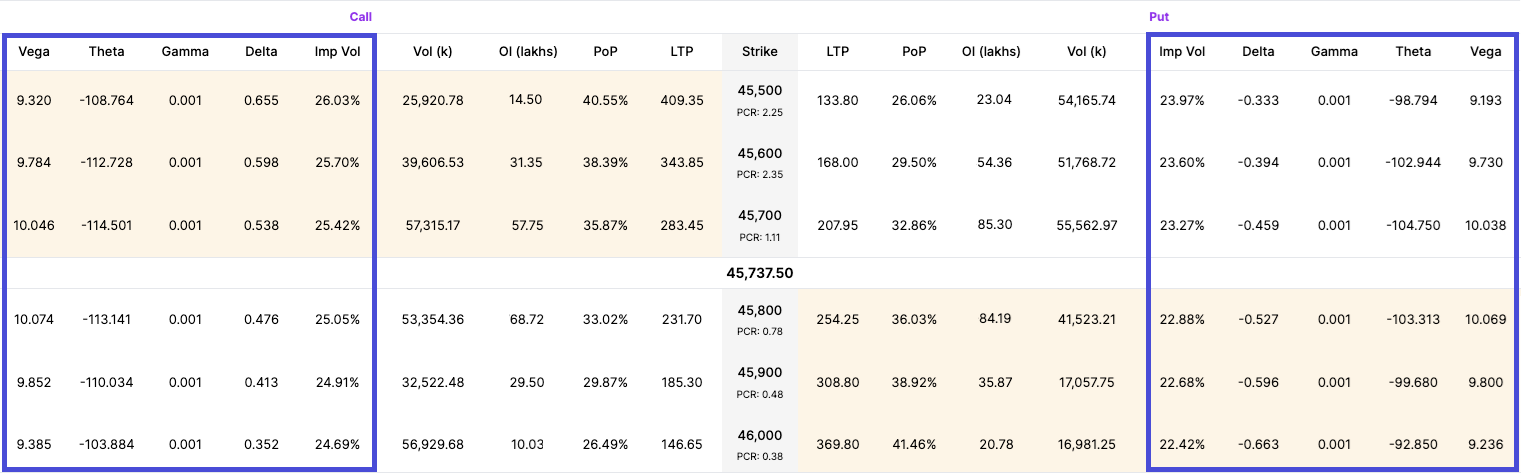 Source: Upstox
At the end of this course, we want you to learn the following two key points:
- How are options priced? To buy low and sell high, you need to understand how to “spot a deal.”
- What happens to option prices if things change, like the underlying stock price or time?
With that said, let’s jump into our first lesson in this course: an introduction to standard deviation.
Summary
This course on "Volatility and the Greeks" builds upon the basics of options trading, focusing on how volatility and the Greeks impact option pricing. You'll learn to analyze key metrics like implied volatility, delta, theta, and more, helping you spot opportunities to buy low and sell high. By the end, you'll understand how changes in underlying prices or time affect option prices, improving your trading decisions.
Is this chapter helpful?
- Home/
- Volatility and The Greeks