Logo

TVS Motor Company Share Price

NSE: TVSMOTOR
|
Automobile
₹ 3,626.10
-₹13.60 (-0.37%)
1D
Last updated 09 Jul, 2026, 15:52 IST

TVS Motor Company Share Price Today

As of 9 Jul 2026, TVS Motor Company share price is ₹3,626.10. The stock opened at ₹3,657.00, compared to its previous close of ₹3,639.70. During today's trading session, TVS Motor Company share price moved in the range of ₹3,617.50 to ₹3,698.90, with an average price of ₹3,658.20 for the day. Looking at its last 52-week, the stock has touched a low of ₹2,728.70 and a high of ₹3,970.00. On the performance front, TVS Motor Company share price has declined by 4.26% over the last six months and is up 28.58% on a year-on-year basis.


₹3,617.50
0.37% down today
₹3,698.90
1D LOW
1D HIGH

TVS Motor Company Returns Calculator

Open
₹3,657.00
High
₹3,698.90
Low
₹3,617.50
Prev. close
₹3,639.70

Circuit
L
H
₹3,275.80
₹4,003.60
52-week
L
H
₹2,728.70
₹3,970.00

TVS Motor Company Shareholder Returns

TVS Motor Company Share Price History

Mkt Cap Cr
1,75,937.00

P/E
52.98

P/B
16.67

ROE
35.27%

D/E
0.27

ROCE
17.59%

Div. Yield
0.36%

EPS(TTM)
76.09
Turnover
3.65

EV/EBITDA
22.61

Net Margin
7.65%

Op. Margin
12.71%

ROA
6.88%

Quick Ratio
0.42

Curr. Ratio
0.54
Based on fundamentals, this stock's
Step 5 of 5
Performance
Excellent
TVS Motor Co. outperforming all market indices
Step 1 of 5
Valuation
Overvalued
TVS Motor Co. appears overvalued compared to its peers
Step 4 of 5
Earnings
Good
TVS Motor Co. revenue, operating profit and net profit are growing
Peer Comparison
Peer comparison — key ratios
NameMkt Cap CrP/EP/BROED/EROCEBook ValueDiv. YieldTurnoverEPS(TTM)
Maruti Suzuki4,57,209.0031.154.2713.70%0.0017.51%3,343.160.96%1.64459.46
Mahindra & Mahindra3,97,171.0021.334.2618.37%0.0214.63%597.861.00%1.82130.18
Bajaj Auto2,80,612.0022.836.3228.57%0.0128.35%7.011.71%1.55352.00
Eicher Motors2,06,558.0037.458.2321.97%0.0127.17%794.471.09%0.94183.79
HYUNDAI MOTOR INDIA LTD1,60,656.0029.588.0327.14%0.0633.27%238.391.06%3.1065.50
TATA MOTORS LIMITED1,58,359.0047.9511.4034.02%0.4228.42%10.841.01%3.859.13
Tata Motors1,26,092.001.330.9775.90%0.232.31%4.371.01%1.9714.26
Hero MotoCorp99,902.4017.304.6226.57%0.0133.40%1,078.403.71%2.03263.34
Ashok Leyland96,390.0025.926.7724.37%0.0912.51%22.332.13%2.876.07
ATHER ENERGY LIMITED43,116.40-83.3616.76-20.10%0.26-12.77%67.150.00%1.10-13.99

TVS Motor Company Financials

Full statement

Income Statement · Consolidated

Income Statement · Consolidated — all values in INR Crore
ParticularsMar 2026Mar 2025Mar 2024Mar 2023
Revenue₹56,069.52₹44,089.01₹38,778.82₹31,973.99
Other Income₹22.01₹69.56₹105.82₹138.00
Total Revenue₹56,091.53₹44,158.57₹38,884.64₹32,111.99
Total Expenses₹51,178.65₹40,579.10₹36,173.55₹30,133.36
Profit Before Tax₹4,821.74₹3,505.35₹2,667.62₹1,936.03
Tax₹1,635.31₹1,155.45₹914.04₹626.57
Profit After Tax₹3,186.43₹2,349.90₹1,753.58₹1,309.46
EPS - Basic₹63.53₹47.05₹35.50₹27.97
EPS - Diluted₹63.53₹47.05₹35.50₹27.97

Cash Flow · Consolidated

Cash Flow · Consolidated — all values in INR Crore
ParticularsMar 2026Mar 2025Mar 2024Mar 2023
Profit before tax₹4,821.74₹3,527.84₹2,702.92₹1,936.03
Income before WC changes₹6,506.92₹4,965.88₹3,974.39₹2,930.53
Change in Assets-₹5,877.23-₹1,506.37-₹5,891.25-₹7,394.34
Change in Liabilities₹2,862.41₹1,190.06₹1,623.61₹666.87
Change in WC-₹3,014.82-₹316.31-₹4,267.64-₹6,727.47
Cash flow from Operations₹1,866.59₹3,502.92-₹1,252.67-₹4,404.81
Cash flow from Investing-₹2,964.47-₹2,898.96-₹1,481.36-₹1,307.76
Cash flow from Financing₹909.33₹1,155.24₹3,238.64₹6,118.08
Total Cash Flow-₹188.55₹1,759.20₹504.61₹405.51
Cash (Start of the year)₹4,115.00₹2,355.80₹1,851.19₹1,445.68
Cash (End of the year)₹3,926.45₹4,115.00₹2,355.80₹1,851.19

Balance Sheet · Consolidated

Balance Sheet · Consolidated — all values in INR Crore
ParticularsMar 2026Mar 2025Mar 2024Mar 2023
Non-Current Assets₹25,031.19₹21,952.66₹20,700.45₹18,208.63
Current Assets₹31,469.43₹25,984.25₹21,520.01₹17,024.28
Total Assets₹56,500.62₹47,936.91₹42,220.46₹35,232.91
Current Liabilities₹32,067.68₹23,173.54₹21,078.21₹19,218.70
Net Current Asset-₹598.25₹2,810.71₹441.80-₹2,194.42
Non-Current Liabilities₹13,720.08₹15,321.10₹13,631.14₹10,104.36
Equity Capital₹10,712.86₹9,442.27₹7,511.11₹5,909.85
Total Equity & Liabilities₹56,500.62₹47,936.91₹42,220.46₹35,232.91

Income Statement · Standalone

Income Statement · Standalone — all values in INR Crore
ParticularsMar 2026Mar 2025Mar 2024Mar 2023
Revenue₹47,270.32₹36,251.32₹31,776.37₹26,378.09
Other Income-₹29.97-₹41.29₹148.53₹100.57
Total Revenue₹47,240.35₹36,210.03₹31,924.90₹26,478.66
Total Expenses₹42,295.46₹32,688.49₹29,144.24₹24,475.29
Profit Before Tax₹4,903.52₹3,521.54₹2,780.66₹2,003.37
Tax₹1,288.30₹917.56₹697.66₹512.34
Profit After Tax₹3,615.22₹2,603.98₹2,083.00₹1,491.03
EPS - Basic₹76.09₹55.44₹43.84₹31.38
EPS - Diluted₹76.09₹55.44₹43.84₹31.38

Cash Flow · Standalone

Cash Flow · Standalone — all values in INR Crore
ParticularsMar 2026Mar 2025Mar 2024Mar 2023
Profit before tax₹4,903.52₹3,544.03₹2,780.66₹2,003.37
Income before WC changes₹6,092.87₹4,616.64₹3,579.11₹2,683.50
Change in Assets-₹1,748.48-₹968.22-₹344.02-₹388.77
Change in Liabilities₹2,586.64₹1,477.55₹998.39₹180.74
Change in WC₹838.16₹509.33₹654.37-₹208.03
Cash flow from Operations₹5,730.14₹4,291.99₹3,617.29₹1,992.86
Cash flow from Investing-₹4,309.70-₹3,970.29-₹1,896.26-₹2,311.80
Cash flow from Financing-₹1,344.06-₹587.79-₹1,469.55₹224.54
Total Cash Flow₹76.38-₹266.09₹251.48-₹94.40
Cash (Start of the year)₹324.45₹490.27₹234.35₹328.75
Cash (End of the year)₹400.83₹324.45₹485.83₹234.35

Balance Sheet · Standalone

Balance Sheet · Standalone — all values in INR Crore
ParticularsMar 2026Mar 2025Mar 2024Mar 2023
Non-Current Assets₹18,864.15₹14,831.92₹11,844.42₹10,307.84
Current Assets₹7,051.54₹5,120.18₹4,217.82₹3,684.55
Total Assets₹25,915.69₹19,952.10₹16,062.24₹13,992.39
Current Liabilities₹12,975.63₹8,462.44₹6,606.80₹6,008.55
Net Current Asset-₹5,924.09-₹3,342.26-₹2,388.98-₹2,324.00
Non-Current Liabilities₹1,705.76₹1,592.44₹1,724.40₹1,935.99
Equity Capital₹11,234.30₹9,897.22₹7,731.04₹6,047.85
Total Equity & Liabilities₹25,915.69₹19,952.10₹16,062.24₹13,992.39
* All values are in INR Crore
Qty
Bid
18
3626.1
0
0
0
0
0
0
0
0
Ask
Qty
0
0
0
0
0
0
0
0
0
0
Bid Total: 18
Ask Total: 0
Buy orders: 100%
Sell orders: 0%
Bearish
1
Neutral
6
Bullish
1
Neutral
by SEBI experts
Expert Pick
EXPPICK
Stop-loss
Entry price
Target
Indicator
Value
Verdict

RSI (14)
59.85
Neutral

ATR (14)
91.25
Neutral

STOCH(9,6)
60.9
Neutral

STOCH RSI (14)
55.08
Neutral

ADX(9)
34.41
Bearish

UO(9)
49.71
Neutral

ROC(12)
5.72
Bullish

WillR(14)
-33.88
Neutral
Period
Simple value
Exponential vaue

5D
3662.32
3642.44

10D
3573.33
3591.83

20D
3492.88
3531.18

50D
3469.63
3504.78

100D
3569.96
3537.61

About TVS Motor Company

TVS Motor Company logo
ISIN
INE494B01023
Sector Market Cap
₹ 1,75,937 Cr

Established in: 1911

Managing Director: Sudarshan Venu

TVS Motor Company Limited is a multinational motorcycle manufacturing company, headquartered in Chennai. It was founded in 1911 by T. V. Sundram Iyengar. The company is the third-largest motorcycle company in India based on revenue, boasting annual sales of in millions with an annual production capacity of over four million vehicles. It is the second-largest two-wheeler exporter in India, exporting vehicles to over 60+ countries in the world.

TVS Motor Company Limited is a flagship company of the TVS Group that boasts high market valuation and turnover. The company launched its IPO and went public in 1997. It is listed on the BSE and NSE, trading under the ticker symbols 532343 and TVSMOTOR, respectively.

History of TVS Motor Company Limited

TVS was founded by T. V. Sundram Iyengar, who started Madurai’s first bus service in 1911. The company started as a transportation business with a large number of trucks and buses.

TVS expanded from a regional transport operator into a conglomerate and entered the auto component manufacturing in 1962. With the launch of TVS 50 in 1980, the company entered the two-wheeler industry.

TVS founded Sundaram Clayton in agreement with a UK firm to manufacture brakes, compressors and auto parts. Later, the company set up a Hosur manufacturing plant and introduced the TVS 50, which was India’s first two-seater moped.

In 1982, the TVS group partnered with Japan's Suzuki Motor Corporation to produce motorcycles, eventually launching iconic models like the TVS Suzuki Shogun, Samurai, and Fiero. When their joint venture ended in 2001, TVS bought out Suzuki's stake and was subsequently incorporated as TVS Motor Company.

Business Segments of TVS Motor Company Limited

The following are the business segments of TVS Motor Company Limited.

  • Automotive Vehicles and Components

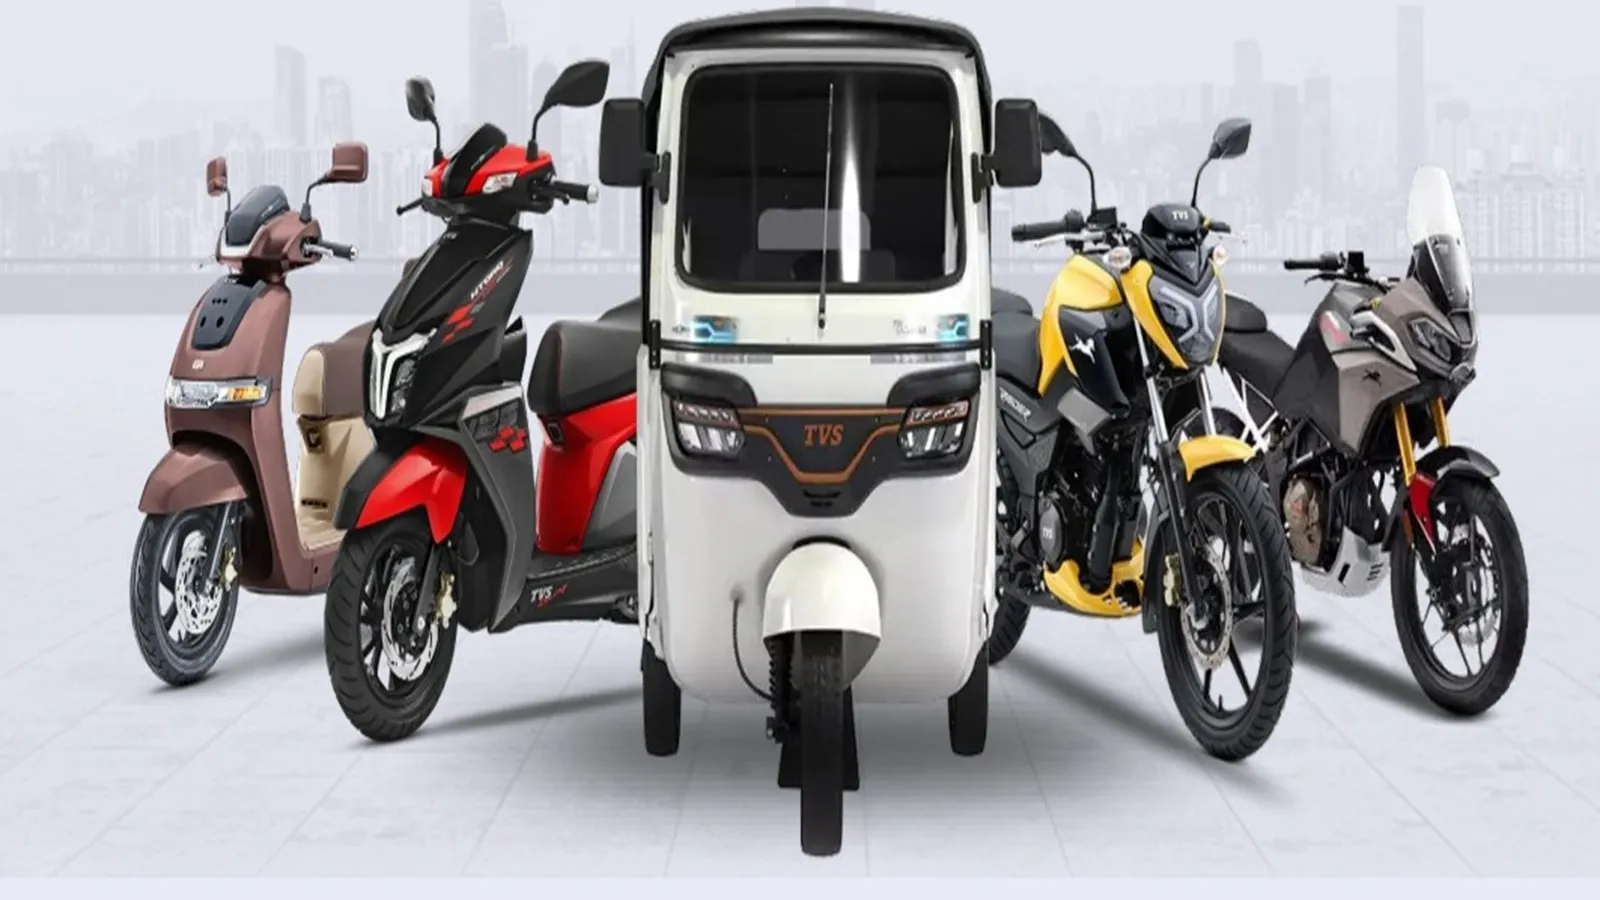
This is the primary revenue-generator segment of the company. It involves producing, marketing and selling two-wheelers such as motorcycles, scooters, electric vehicles, mopeds, and three-wheelers globally.

  • Financial Services

The company also offers financial services such as vehicle financing to its customers, insurance distribution and mobility support services. Future Plans of TVS Motor Company Limited

The following are the future plans of TVS Motor Company Limited.
  • Manufacturing Capacity Expansion

TVS Motor Company Limited is currently constructing a new manufacturing plant, which is expected to be completed by 2028. This new facility will add up to 2.5 million units of capacity and help the company hit their 100 million target.

The company has invested significantly in expanding its production capacity, strengthening R&D and launching new products for the internal combustion and EV portfolio. The company is expanding its manufacturing capacities in India and Indonesia and is currently establishing a Global Capacity Centre in Dubai to grow its market presence in the Middle East and Africa.

  • Electric Vehicles

The company is planning to introduce new and more affordable variants and entry-level models to increase its sustainable footprint. The company has partnered with Hyundai Motor Company to co-develop and commercialise electric three-wheelers. The company is producing select Norton Motorcycles models in India and is working on expanding its product portfolio with sub-500cc and adventure-style bikes such as RTX 300.

  • Digital Tech

TVS Motor Company Limited has entered into a joint venture with ALA group to enter the aerospace and defence supply chain market with the aim of securing ₹2,000 crore in revenue by 2031. The company is also integrating AI-driven battery management, navigational assists, and virtual modelling into both their product offerings and manufacturing operations

TVS Motor Company Financial Highlights

  • Revenue: TVS Motor Company reported revenue of ₹56,091.53 crore in FY26 vs ₹44,158.57 crore in FY25. It showed an increase of 27.02% on a yearly basis.
  • Operating Profit: TVS Motor Company reported an operating profit of ₹4,821.74 crore in FY26 vs ₹3,505.35 crore in FY25. It showed an increase of 37.55% on a year-on-year basis.
  • Net Profit: TVS Motor Company reported a net profit of ₹3,186.43 crore in FY26 vs ₹2,379.81 crore in FY25. It showed an increase of 33.89% on a yearly basis.

TVS Motor Company Quarterly Result Highlights

  • TVS Motor Company reported revenue of ₹15,059.38 crore in Mar 2026, compared with ₹14,745.22 crore in Dec 2025, representing an increase of 2.13% on a quarter-on-quarter (QoQ) basis.
  • TVS Motor Company reported an operating profit of ₹1,298.13 crore in Mar 2026, compared with ₹1,323.13 crore in Dec 2025, representing a decrease of 1.89% on a quarter-on-quarter (QoQ) basis.
  • TVS Motor Company reported a profit of ₹819.55 crore in Mar 2026, compared with ₹891.26 crore in Dec 2025, reflecting a decrease of 8.05% on a QoQ basis.
  • The earnings per share (EPS) of TVS Motor Company stood at ₹63.53 during Mar 2026.
Know more
Promoters
50.27%
FII
22.57%
Other DII
4.39%
Retail and other
8.33%
Mutual funds
14.45%
Foreign institutions - FII
Compare against other stocks
TVS Motor Company logo
TVS Motor Company
Automobile
Add Stock
Add Another

FAQs on TVS Motor Company Share Price