FSN E-Commerce Ventures Limited owns and operates Nykaa, a leading online retailer specialising in beauty, wellness and fashion products. It was founded in April 2012 by billionaire Falguni Nayar.
Operating through its website, mobile app and a network of over 100 outlets, it made history in 2020 to become the first Indian unicorn startup led by a woman entrepreneur. Its website was launched in 2012.
Falguni Nayar has transformed Nykaa into one of India's foremost beauty products and lifestyle brands over the years. The company caters to nearly one crore shoppers through its retail stores and online platforms.
Nykaa's combined total addressable market (TAM) exceeded $100 billion in FY23.
Nykaa initial public offering (IPO) was launched in November 2021 to raise ₹5,351.92 crore. This took Nykaa’s valuation to nearly ₹95,437 crore. This also made Nayar India's richest self-made businesswoman.
Nykaa shares were listed on BSE and National Stock Exchange (NSE) on November 10, 2021. Nykaa market capitalisation stood at over ₹49,600 crore as on December 20, 2023. Nykaa share price has dropped more than 91% compared to its listing price of ₹2,001 apiece on BSE.
Nykaa's business operations
Nykaa initially focused on beauty products but evolved in 2015 to adopt an omnichannel approach. It expanded its portfolio to include a wide range of products including accessories and apparels.
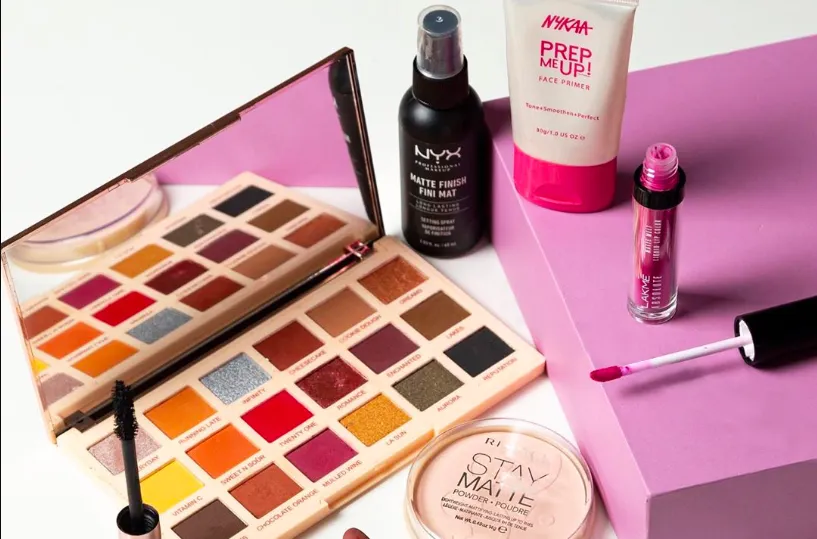
Nykaa has a collection of over 6,250 brands. They include products across makeup, skincare, haircare, bath, bodycare, fragrances, grooming tools and personal care items as well as health and wellness essentials.
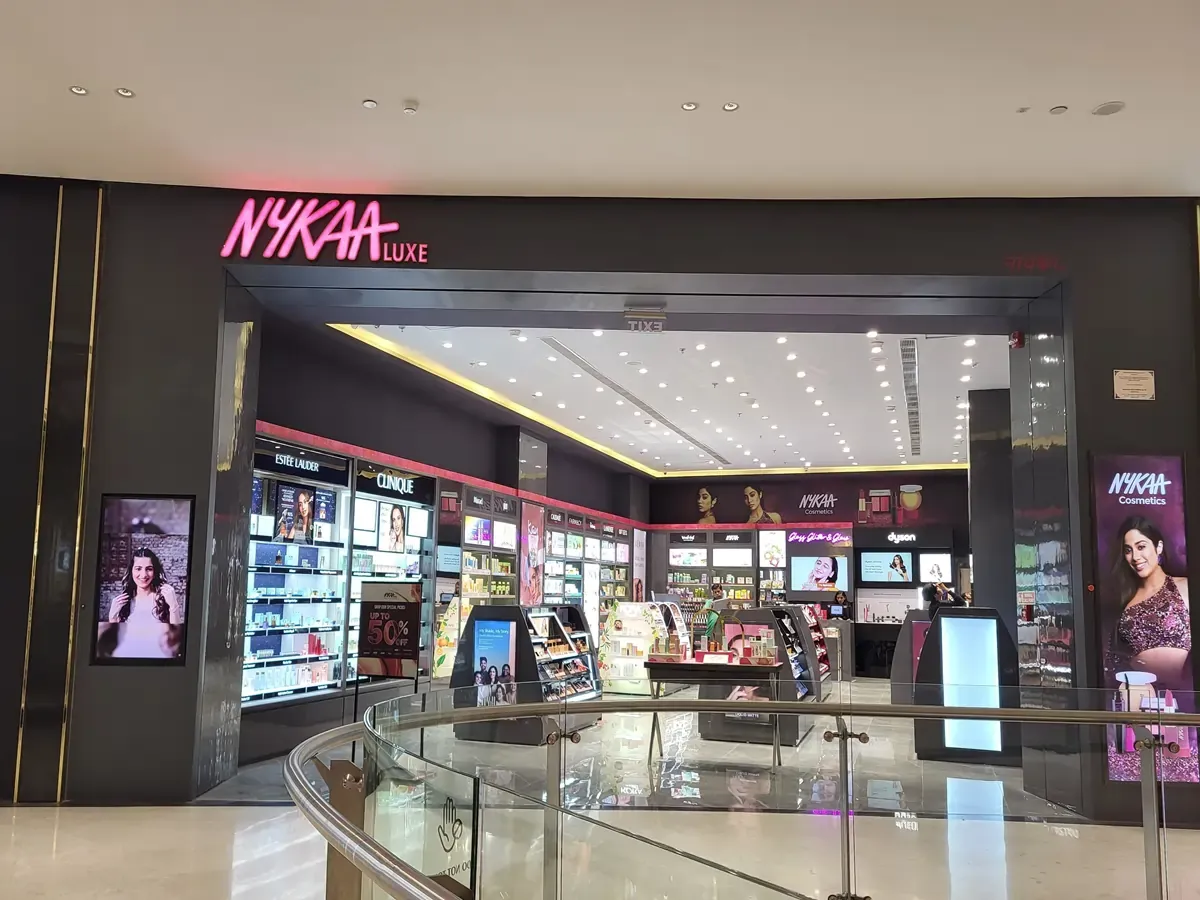
The company's beauty and personal care (BPC) network comprised 145 stores as of the end of FY2023. This included Nykaa Luxe, Nykaa On Trend and Kiosks. The company's BPC vertical contributes more than 8% to its gross merchandise value (GMV).
Nykaa has increased its portfolio of brands in beauty and fashion in the financial year 2022-23. It introduced Ayurveda-inspired beauty products under its brand Nyveda in 2023. It also ventured into nutraceuticals through the brand Nudge.
Nykaa launched six new consumer brands including Mixt for Gen Z and Gloot for men's fashion in FY23. Existing brands like Nykaa Cosmetics and Nykd by Nykaa gained significant traction among consumers.
Nykaa Financial Highlights
- Revenue: Nykaa reported revenue of ₹10,055.12 crore in FY26 vs ₹7,977.08 crore in FY25. It showed an increase of 26.05% on a yearly basis.
- Operating Profit: Nykaa reported an operating profit of ₹330.23 crore in FY26 vs ₹127.45 crore in FY25. It showed an increase of 159.11% on a year-on-year basis.
- Net Profit: Nykaa reported a net profit of ₹203.94 crore in FY26 vs ₹73.70 crore in FY25. It showed an increase of 176.72% on a yearly basis.
Nykaa Quarterly Result Highlights
- Nykaa reported revenue of ₹2,657.32 crore in Mar 2026, compared with ₹2,879.52 crore in Dec 2025, representing a decrease of 7.72% on a quarter-on-quarter (QoQ) basis.
- Nykaa reported an operating profit of ₹121.52 crore in Mar 2026, compared with ₹109.62 crore in Dec 2025, representing an increase of 10.86% on a quarter-on-quarter (QoQ) basis.
- Nykaa reported a profit of ₹78.75 crore in Mar 2026, compared with ₹67.74 crore in Dec 2025, reflecting an increase of 16.25% on a QoQ basis.
- The earnings per share (EPS) of Nykaa stood at ₹0.23 during Mar 2026.