Basics of Options
Put Call Ratio
Introduction to Put Call Ratio
😀 😢 😡 Emojis—love them or hate them, they are popularly accepted shorthand to describe or express emotions and moods. But did you know the market has its moods too? Gauging the mood of the market is essential when you are planning a trading strategy. How do you do that? By using a combination of ratios and indicators. In this chapter, we will look at one such commonly used indicator—the Put Call Ratio or PCR.
What is the Put Call Ratio or PCR?
‘Buy low -> sell high -> repeat’ is probably one of the most popular trading phrases. Luckily, markets being cyclical—moving from phases of extreme pessimism to irrational exuberance, then back to extreme pessimism and so on—you can get away with repeating the above contrarian strategy in the following manner:
- Extreme pessimism -> You buy
- Irrational exuberance -> You sell
If you often hedge your bets using this strategy, it’s time you learned what the Put Call Ratio (PCR) is. The PCR can help indicate when markets have reached pessimism or exuberance zones and are about to reverse.
Note of Caution
No one ratio or indicator can definitively indicate the market’s top or bottom. Most successful traders use confirmation from multiple sources before making a trading decision.
How is PCR calculated?
It is a simple ratio found by dividing the total open interest of put options by the total open interest of call options.
Key Formula:
- Put Call Ratio = (Total Put OI / Total Call OI)
The PCR will generally fluctuate above and below 1. Instead of OI, one could alternatively use the volume or value of all the option contracts. (Calculation details are shared towards the end of this chapter). But before we go there, let’s see how to interpret and use PCR.
How to interpret PCR?
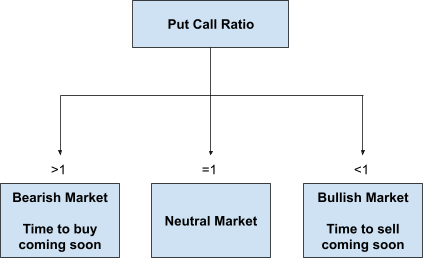
PCR can be above 1, below 1, or 1. Here is how you interpret each scenario:
-
PCR above 1: It suggests that more puts are being bought compared to calls. The mood of the majority of traders is bearish, making the market oversold or low. Since the majority is bearish, there are fewer traders to take the market further down. Eventually, the bears will reverse their position (i.e., buy) and take the market up. What you can do: Buy low!
-
PCR below 1: It indicates that more calls are being bought compared to puts. The market sentiment is bullish. As the ratio keeps falling, the bullish sentiment grows stronger. At some point, the majority of traders are bullish, making the market overbought. Eventually, the bulls will book profits (i.e., sell) and take the market down. What you can do: Sell high!
-
PCR of 1: The bulls and bears are even. It indicates that trading activity is normal.
Illustration 1: Put Call Ratio
 Source: Upstox
How much PCR is too much?
At what figures does the PCR give buy or sell signals? There is no definitive answer to this. However, you can backtest by plotting historical daily PCR. You may not get the exact point where markets will peak or bottom, but you can use past extreme values as indicators of zones where markets could reverse.
How to calculate PCR? (in detail)
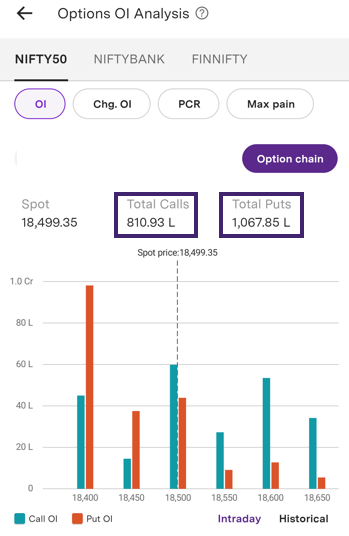
To calculate the Nifty50’s PCR, find the total OI of all the calls and puts. In the Upstox Pro app, you can find this under the Discovery tab. Once you scroll down to the OI Analysis section, you can select ‘Analyze in detail’ to view the screen that contains the total OI for calls and puts.
Illustration 2: Nifty50 OI Analysis
 Source: Upstox
As shown in the image above:
- Total Put OI = 1067.85L
- Total Call OI = 810.93L
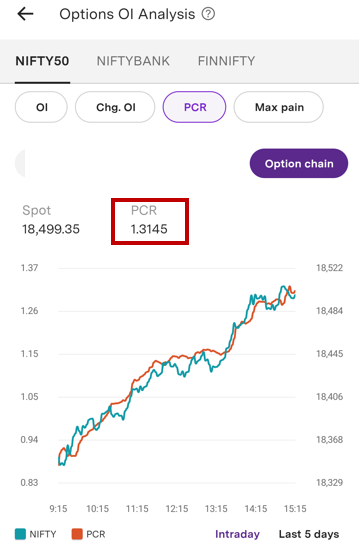
This indicates an underlying past bearish trend and a potential opportunity to ‘buy low.’ If you don’t want to perform the calculation manually, you can simply click the ‘PCR’ button. On this screen, you will see the PCR for the index, as highlighted by the red box. The slight difference in values is due to the difference in time when the two screenshots were taken.
Illustration 3: Nifty50 PCR Analysis
 Source: Upstox
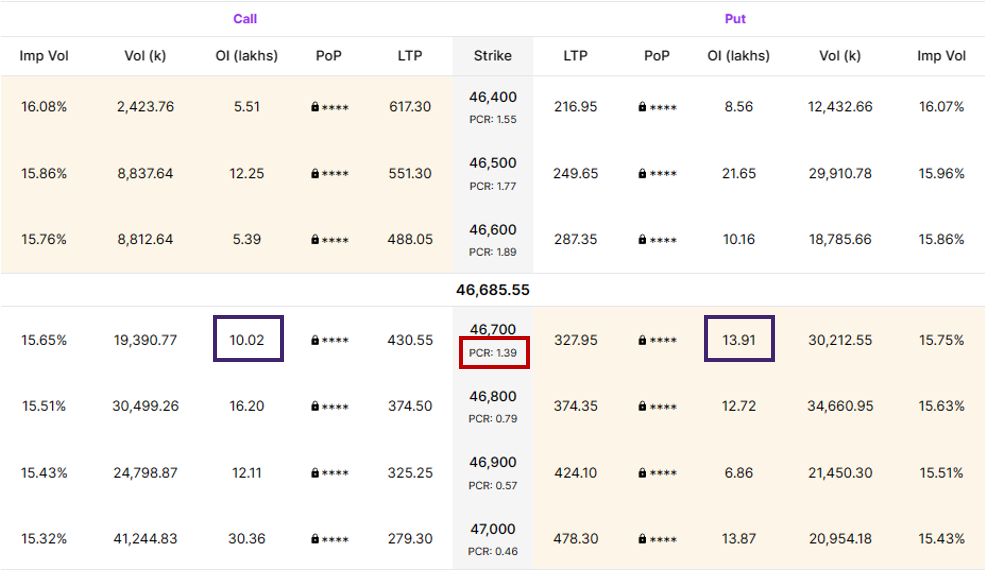
In addition to examining the total open interest for puts and calls, you can look at the OI for individual strike prices. This provides a bullish or bearish sentiment for certain price levels, offering insight into support and resistance levels. For example, in the illustration below, we display the Upstox option chain for the Nifty Bank. At the 46700-strike price, you will see that the OI for puts is 13.91L and the OI for calls is 10.02L.
- 46700-Strike Put OI = 13.91L
- 46700-Strike Call OI = 10.02L
While you can calculate the Put Call Ratio manually, this value is also provided underneath the strike price in the option chain. You will see this highlighted by the red box in the illustration below.
Illustration 4: Nifty Bank option chain
 Source: Upstox
This concludes our round-up on PCR. We will see you in the next chapter.
Summary
- PCR indicates the mood of the market. It does not indicate the exact point of market reversal.
- PCR is the ratio of total open interest of put options to the total open interest of call options.
- PCR above 1 indicates a bearish mood and an opportunity to Buy Low.
- PCR below 1 indicates a bullish trend and an opportunity to Sell High.
- PCR of 1 indicates a neutral market.
- Do not consider PCR in isolation. Use it with other indicators.
Is this chapter helpful?
- Home/
- Put Call Ratio