Chart Patterns - An Introduction
Chart Patterns
- Overview
In my previous blogs, we learned how to read candlesticks (part 1 and part 2). In this blog, we will check out some chart patterns.
What is a chart?
A chart is a collection of candlesticks helping us to know how the stock will perform. Chart patterns help traders to know the direction where the stock will move. Patterns help to make long-term or short-term prediction. Chart patterns can be for one day or months or even for years. A few chart patterns are Head and Shoulders, ** Double Top and Double Bottom**, Triple Tops and Bottoms, Cup and Handle, Triangles, Flags, and Pennants, Gaps, Round Bottoms and Wedge.
We will go through the following patterns here:
-
Head and Shoulders
-
Double Top and Double Bottom
-
Triple Tops and Bottoms
Head and Shoulders Chart Pattern
This is one of the most popular patterns. This is also considered one of the most reliable chart patterns in Technical Analysis. This Pattern has two versions. Head and shoulders top and Head and shoulders bottom (Inverse Head and Shoulders).
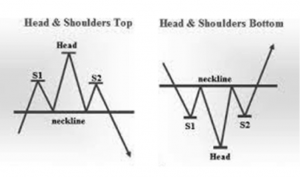
Head and Shoulders Top
A pattern is divided in 4 parts viz Head, Left Shoulder, Right Shoulder and Neckline. It starts with forming left shoulder (S1) when a stock reaches new high and comes down. Formation of Head occurs when stock breaches the level of S1 and creates new highs and comes back to the low level created after S1. The third step is to form the Right shoulder (S2) where stock rises again but could not reach the Head level instead it could be near about the same level of S1 followed by stock falling again to the lower level created after S1 and the Head. Lower level created between S1, Head and S2 is called a neckline. The pattern is complete when a stock breaks the Neckline. The neckline is also called a support. A speculator will short the stock once it is trading below the neckline. Target will be the height between the Head and the neckline from the neckline heading downwards. Head and shoulders Top is a reversal of an uptrend
Head and Shoulders Bottom
Head and Shoulders Bottom is reverse of Head and Shoulders Top chart pattern. Here the stock starts falling during a downtrend and creates a low forming a left shoulder S1. The stock then rises up to a level where it finds difficult to rise. It results in stock declining from the resistance level and creates new low (Head) breaking the level of S1. After creating a new low, stock rises up and tries to break the resistance level once again and falls back up to a level of S1. Thus creating a Right shoulder (S2)of the pattern. Stock rises again and tries to break the resistance level (Neckline) for the third time. The pattern is complete when a stock breaks the neckline. An investor or trader can enter into this pattern once the neckline is broken. Target will be the height between the Head and the neckline from the neckline heading upwards. Head and shoulders Bottom is a reversal of a downtrend.
Head and shoulder are based on Dow Theory’s Peak and through analysis. Upward peaks and upward troughs in succession hints an upward trend. Similarly, downward peaks and downward troughs in succession hints a downward trend.
Double Top and Double Bottom
Double Top and Double bottom is again a renowned chart pattern. These are reversal patterns which illustrate the continuation of existing trends. Here, the stock tries to move higher but fails and the trend is reversed.
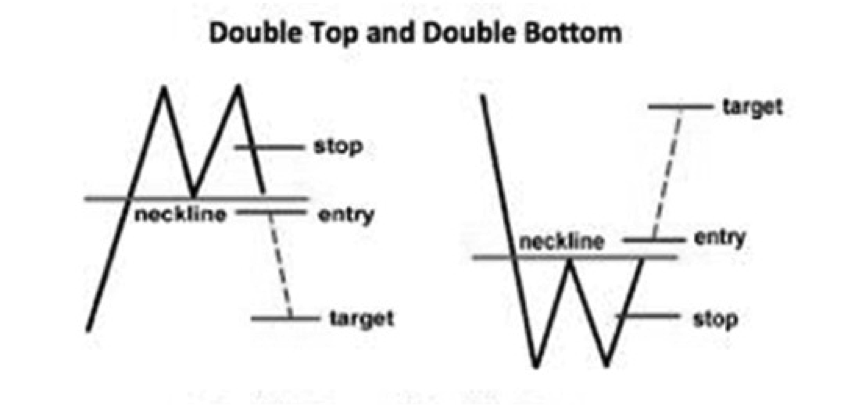
Double Top
Double Top resembles English letter ‘M’. Generally you can find this pattern when stock is trading at its peak. Due to a strong resistance it cannot withhold and the stock falls. Double Top is reversal of an Uptrend. During the initial stage of the pattern stock reaches new highs during its uptrend and falls to a level of support. At next stage we can see the stock rises to its high and falls again due to resistance to the support level or the Neckline. Pattern is complete when a stock falls below the level of support. Stock thus enters a downtrend. When the stock breaks the neckline, it is surely to go down upto the point from where the stock has started to rise. Volume is the main constraint to watch along with this pattern.
Double Bottom
Double Bottom resembles English letter ‘W’. It is exactly the opposite of Double Top. This pattern is found when the stock is at its low. Stock rises from the bottom upto the resistance level and falls again to the previously created low level. Stock after hitting the low for the 2nd time rises upto the resistance level or the neckline. If stock manages to break the neckline, stock will rise atleast upto the initial high before it started to fall. Pattern is complete when stock breaks the neckline of level of resistance and enters in uptrend. Again, volume is the main constraint to watch.
Triple Top and Triple Bottom
Triple Top and Triple Bottom are reversal chart patterns when stock fails to break the resistance or the support. Stock tries to break resistance or support for 3 attempts but fails resulting in stock to move in the reverse direction of the ongoing trend.
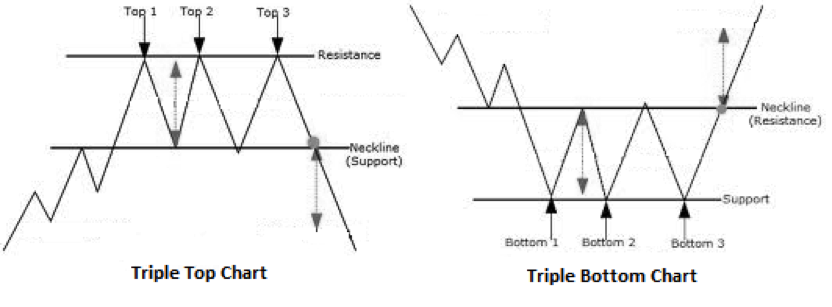
Triple Top
You can say this is an extended version of the Double Top chart pattern. Where stock creates a high (Top1) during its uptrend but it is halted by selling pressure and stock moves down until it finds a good support. As stock is still in an uptrend, rises again and tries to break the level of Top1 but could not really break the level thus creating Top2. Due to selling pressure stock falls to the support level and rises again and tries to break the top for the third time. Top3 is created at this level. As it tries to break this level third time, bulls give up and bears take control and bring the stock down to the support level. If the stock breaks the support level (Neckline) the pattern is complete and stock enters in downtrend and may result in heavy fall in price of the stock. Patience is the key for an investor to enter in this stock due to upward and downward movement of the stock. This stock remains range bound for a while as it trades between two levels.
Triple Bottom
Triple Bottom seems to be extended version of the Double Bottom chart pattern. This is a bullish reversal pattern and works exactly the opposite of Triple Top and signals reversal of downtrend. Stock trading in downtrend is halted at a good support creating Bottom1. Stock rises from Bottom level until sellers take control from the Resistance level dragging back the stock to same level of Bottom 1 creating Bottom 2. As the support is strong enough stock raises again up to resistance level and falls for the third time to the same level as of Bottom 1 and 2 creating Bottom 3. When bears fails to break the support for third time, it loses control over the stock and Bulls take over and stock rises again. Once the stock breaks the resistance level (neckline) pattern is complete and stock enters in uptrend. Alike Triple Top this pattern is also not that easy to identify.
We will be seeing more of such patterns in my next blog. Happy and Safe Trading!