How to Read Candlesticks
Japanese Candlesticks are very popular in Indian markets. They are similar to ordinary bar charts, but it is important to know how to read candlesticks. Candlesticks provide the body between the opening and closing price
Here are the different types of candlestick formations
-
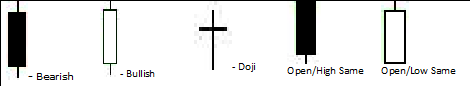
If the opening price is higher than the closing price, it will result in the black or solid candle. (Bearish candle)
-
Whereas if the closing price is higher than the opening price, it results in the white or empty candle. (Bullish candle)
-
When both opening and closing prices are same, it results in a Doji. (Open and close are same or nearly same)
-
When a candlestick has no tail on top, its called a shaven top. (Open and high price is same.)
-
Whereas if the candle has no tail at the bottom, it is called a shaven bottom. (Open and low price is same)
Understanding Candlesticks
Greed and Fear are the two main factors which drive markets. Greed resulting in buying pressure and prices goes up while fear builds selling pressure resulting in price to fall. This factor is shown exactly by candlesticks. By learning how to read candlesticks, we can make out if there was a buying pressure or selling pressure.
The size of a candlestick is an important aspect to know how dominant the buying or selling pressure was. A long white candle indicates that there was a strong buying pressure while a long black candle indicates that there was a strong selling pressure. A small white candle indicates that though there was buying pressure is was not that strong and a small black candle indicates that there was a selling pressure but was not strong.
Candlestick must always be closely read in the view point of buying or selling pressure.
The Shadows of Candlesticks
The shadows or the tail in the candlesticks are equally important as its body. In some cases, shadows or the tail are of more importance than its body.
Understanding the shadows or tails of candlesticks
-
Length of shadows points to improbability.
-
More the length of the shadow or tail, the greater is the improbability and more are the chances of failure.
-
In the bullish trend, the top shadow will be regarded as the degree of failure, whereas in the bearish trend, the bottom shadow or tail will be regarded as the degree of failure
-
In the bullish trend, the bottom shadow or tail will be regarded as the degree of emerging bears, whereas in the bearish trend, the top shadow or tail will be regarded as the degree of emerging bulls.
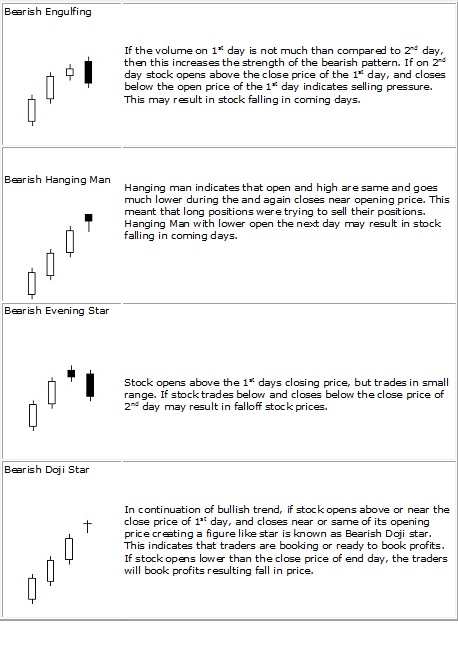
Bearish Candlestick Patterns
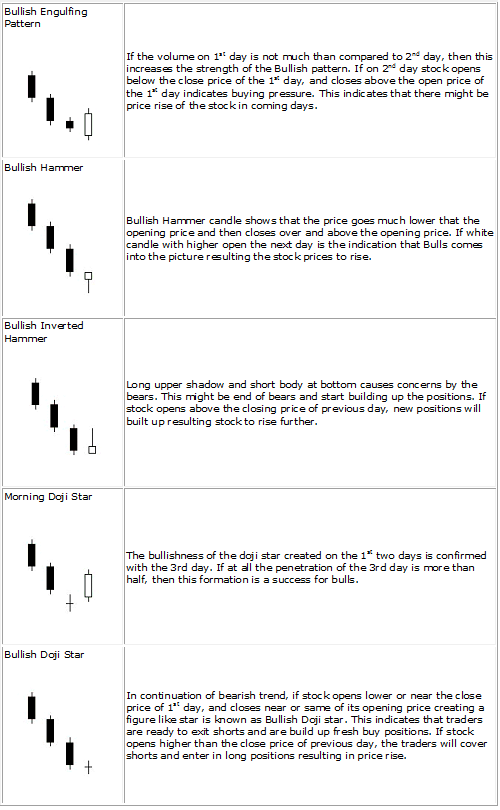
Bullish Candlestick Patterns
In my next blog, we will see more candlestick patterns such as:
-
Bearish Dark Cloud
-
Bearish Evening Doji star
-
Bearish Harami
-
Bearish Harami Cross
-
Bearish Shooting Star
-
Bullish Harami
-
Bullish Harami Cross
-
Bullish Morning Star
-
Bullish Piercing Pattern