Weekly Outlook for 12 to 16 Feb: Inside bar, Inflation, Q3 earnings and F&O cues
Upstox
5 min read • Updated: February 12, 2024, 3:18 PM
Summary
The NIFTY50 continues to face strong resistance at its previous all-time high of 22,124. This week's inside bar candlestick formation on the weekly chart is an important consolidation signal. Traders can monitor the daily price action, especially whether the NIFTY50 closes above or below the weekly candle’s range for further directional clues.
_67864.png)
Markets remained rangebound and closed in the red one week after the announcement of the interim Budget. The NIFTY50 and SENSEX both formed an inside bar candle on the weekly time frame and lost 0.3% and 0.6% respectively, likely in response to the RBI’s Monetary Policy Committee (MPC) decision. Taking a cue from the US Federal Reserve, the MPC retained the key rates, signalling that the fight against the inflation isn’t over yet.
Meanwhile, the broader markets also remained subdued. The NIFTY Midcap 100 rose 0.8% and NIFTY Smallcap 100 closed flat with a negative bias. Both the indices came under profit booking on Friday.
Sectorally, PSU Banks extended their winning streak and gained over 5%. Oil & Gas (+3.8%) and Pharma (+3.5%) followed suit. Private Banks (-2.3%) and FMCG (-2.2%) lagged behind.
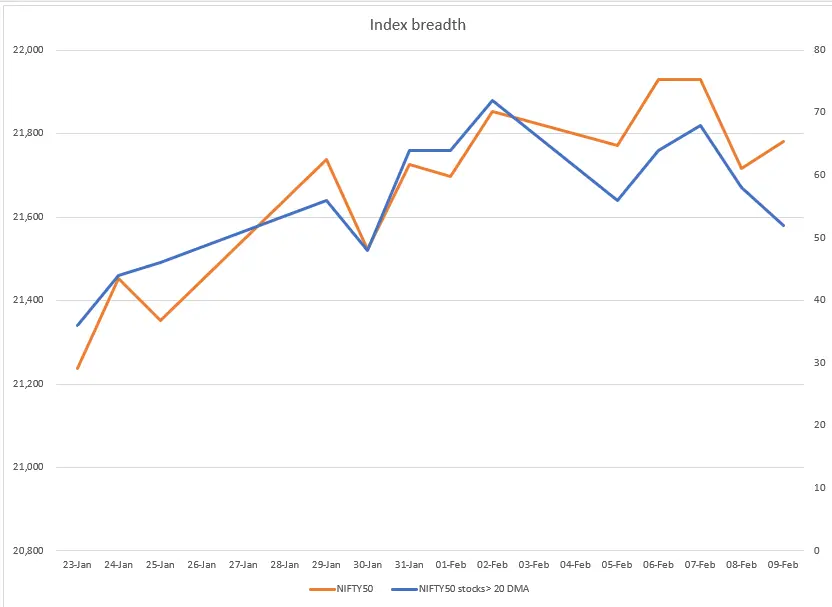
Index breadth - NIFTY50
In our last blog, we cautioned our readers that the NIFTY50 was facing strong resistance due to the bearish engulfing pattern formed in the week ending 19th January. Although a bullish attempt was made in the Budget week, but the selling pressure from previous all-time high capped the upside potential. This week, the NIFTY50 traded sideways in a 400-point range.
This movement coincided with declining breadth as measured by our breadth indicator. On the 2nd February, 72% of the NIFTY50 stocks were trading above their 20-day moving average (DMA). By the end of the week, this figure had fallen to 52%, indicating potential weakness in the index.
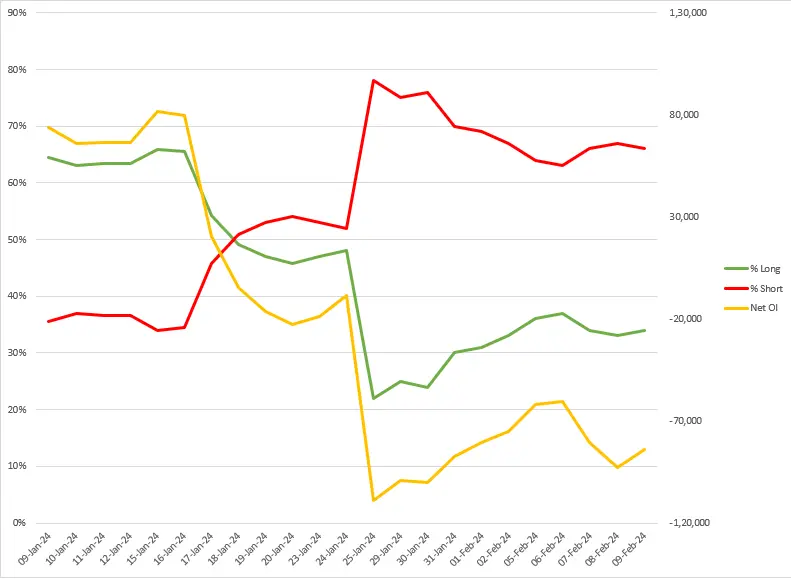
FIIs positioning in the index
As highlighted in last week's blog, monitoring the Foreign Institutional Investor (FIIs) futures open interest (OI) proved insightful. In particular, their short positions, indicating bets on falling prices, rose from 64% at the start of the week to 67% near the weekly expiries and are currently at 66%. Conversely, their long positions, reflecting bullish bets after a small dip, remained unchanged at 34%.
Traders are advised to closely monitor this shift in FII sentiment and its potential impact on both the NIFTY50 and BANK NIFTY.
Click here to track open positions of FIIs in the index futures: Login https://pro.upstox.com/ ➡️F&O➡️FII-DII activity➡️FII Derivatives
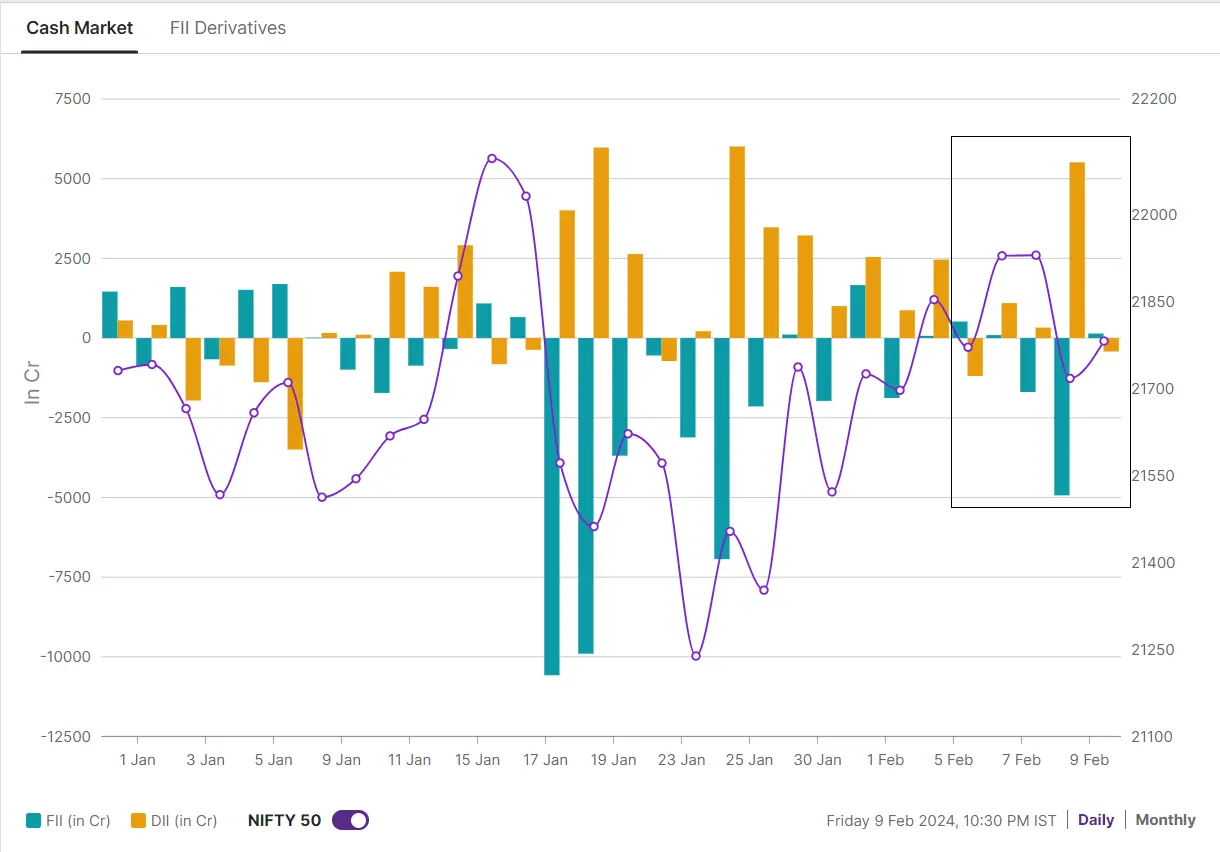
Almost balanced investor activity helped keep the market largely range-bound. FIIs sold shares worth ₹5,871 crore in the cash market while Domestic Institutional Investors (DIIs) bought shares worth ₹5,326 crore.
Click here to track inflows and outflows of FIIs in the cash market: Login https://pro.upstox.com/ ➡️F&O➡️FII-DII activity➡️Cash market
F&O - NIFTY50 outlook
For the 15th February expiry, the call writers are concentrated at the 22,000 and 21,800 strikes. The bulls, on the other hand, have established their base with maximum put writing at the 21,500 and 21,100 strikes. Based on options data, the NIFTY50 is expected to trade between 21,100-22,200.

https://pro.upstox.com/ ➡️F&O➡️OI analysis➡️Nifty50➡️OI/Change in OI
Experts believe, that the NIFTY50 continues to face strong resistance at its previous all-time high of 22,124. This week's inside bar candlestick formation on the weekly chart is an important consolidation signal. Traders can monitor the daily price action, especially whether the NIFTY50 closes above or below the weekly candle’s range for further directional clues.

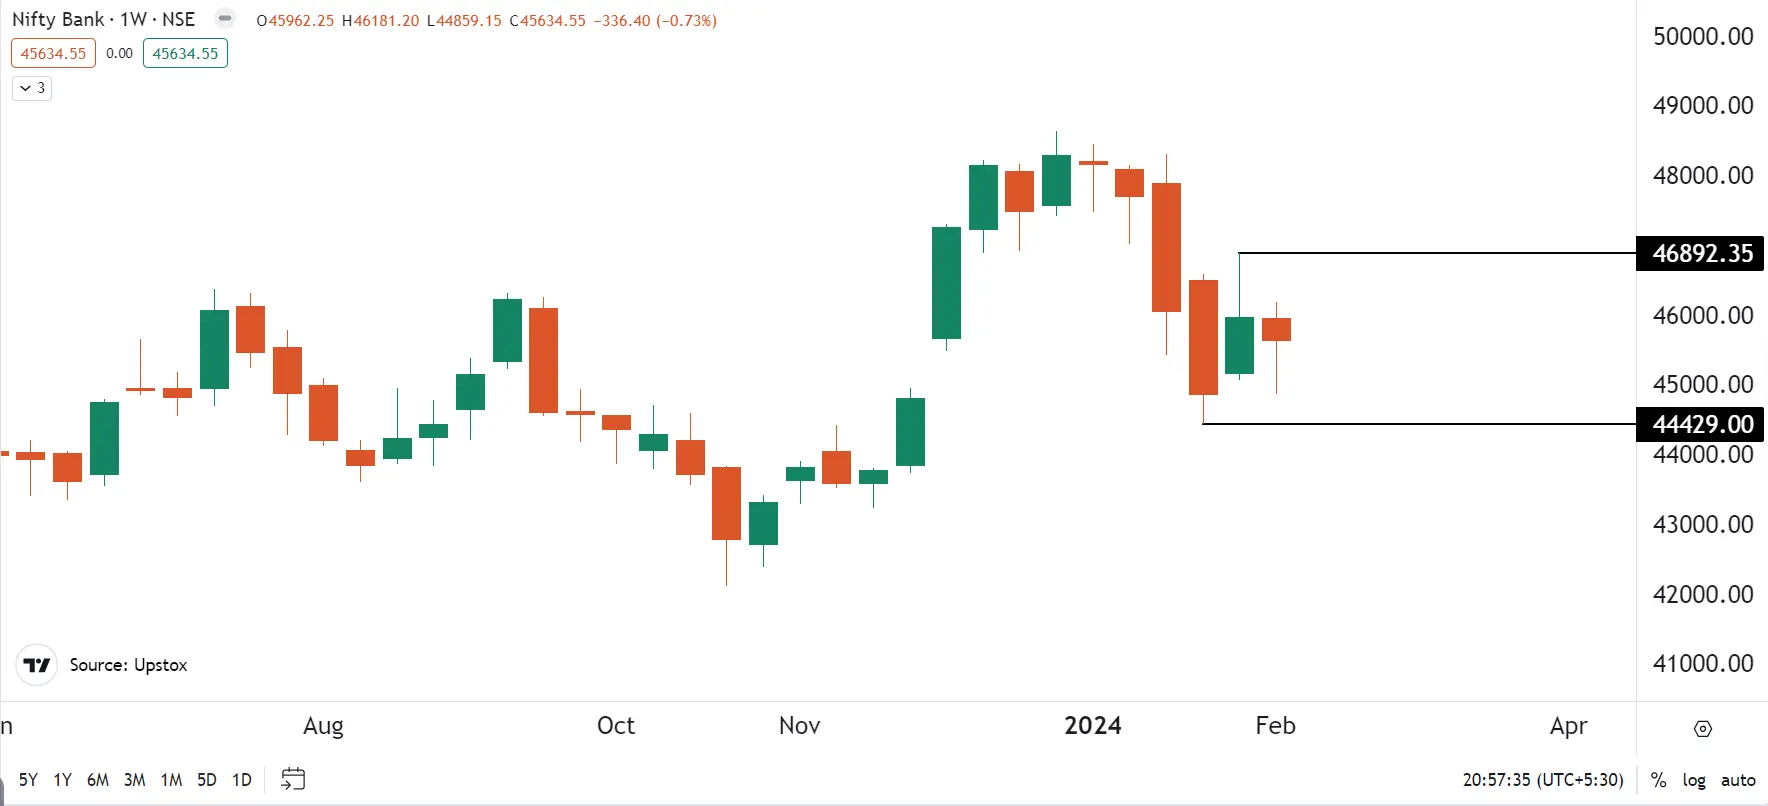
F&O - BANK NIFTY outlook
For the February 14 expiry, significant call writing was observed at 46,000 and 48,000 strikes, while the maximum put writing occurred at 45,000 and 45,500 strikes. Based on the options data, BANK NIFTY is expected to trade between 44,500 and 46,800.
After falling over 8% from its all-time high in the past few weeks, the index has formed a hammer candlestick pattern on the weekly chart. Traders can watch the price action near the reversal pattern in the coming week for further clues. However, according to the experts, the index is facing a stiff resistance around 46,800 level.
📈📉Earnings blitz: Key company’s declaring the Q3 results next week are Coal India, Steel Authority of India, Hindustan Aeronautics, Bharat Forge, Eicher Motors, IRCTC, ONGC, Info Edge, Sun Tv Network, Zee Entertainment, NMDC, Mahindra and Mahindra and IPCA Laboratories.
📅Economic data in focus: India’s Industrial Producion YoY (Dec), Inflation Rate for both US and India for January and WPI Infation of India for January.
💻Spotlight: The S&P 500 index in the US closed above the 5,000 mark first time ever, fueled by tech earnings, easing inflation, and hopes of rate cuts.
📊Stocks in focus: As per the open interest and futures price, the stocks showing long build-up are ACC, Zee Entertainment and Sun Pharma. Similarly, to track the OI losers login https://pro.upstox.com/ ➡️F&O➡️Futures smartlist➡️OI Gainers/OI Losers/Most active.
📓✏️Takeaway: As mentioned above, the NIFTY50 index has formed an inside bar candle on the weekly charts. This signals consolidation. For the upcoming week, the immediate resistance remains near the previous all–time high (22,126).
As regularly highlighted in our morning trade setup blog, traders can keep a close eye on the the 20-day moving average (DMA), which currently stands around 21,700. A break below this level could trigger a further decline towards the next key support level at the 50 DMA, around 21,450.
💡It's important to note that the NIFTY50 formed a bearish engulfing candle on the weekly chart for the week ending 19th January. Despite the recent declines, the index has yet to close below the low of this bearish pattern, which sits at 21,285 on the weekly timeframe.
Disclaimer:
Derivatives trading must be done only by traders who fully understand the risks associated with them and strictly apply risk mechanisms like stop-losses. The information is only for consumption by the client and such material should not be redistributed. We do not recommend any particular stock, securities and strategies for trading. The securities quoted are exemplary and are not recommendatory. The stock names mentioned in this article are purely for showing how to do analysis. Take your own decision before investing.