The Beginning of Precision in Charting
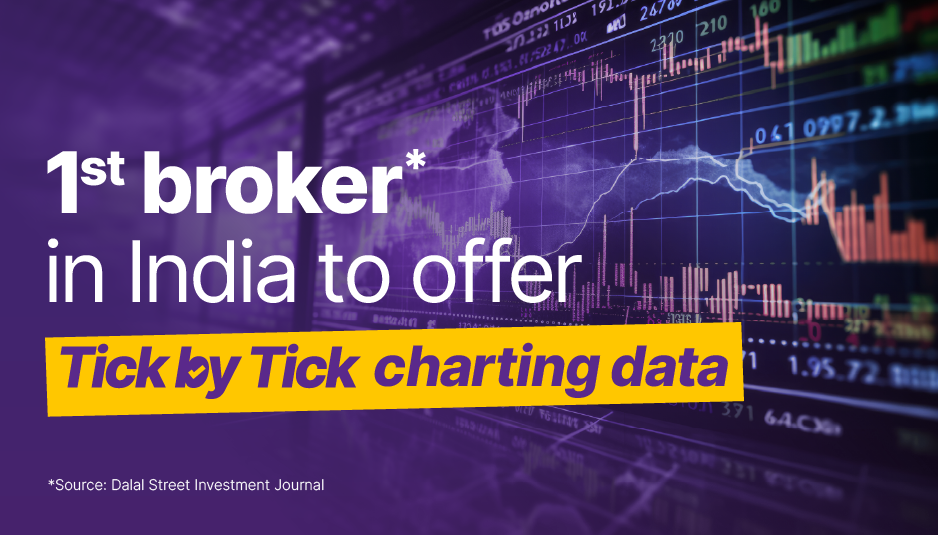
In the fast-paced world of trading, precision is not just an advantage; it's the key to unlocking success. Your trading strategy is only as strong as the accuracy of your market data. At Upstox, we understand this fundamental truth, and are thrilled to introduce a game-changing innovation: Tick-by-Tick (TbT) Charting Data.
📊The Dilemma: Snapshot Data Offers Just A Glimpse
Traditionally, retail traders rely on Snapshot data , the standard on most charting platforms. However, this comes with its own set of limitations. Unlike TbT, Snapshot data provides only a sample (a single trade) rather than all executed trades per second. This can lead to inaccuracies in the displayed OHLC (Open, High, Low, Close) data on candlestick charts, affecting price triggers.
**🚀The Solution: Accurate Charts Powered By TbT Data T bT charts display every individual transaction in the market, including price, volume, and time stamps. It offers a comprehensive view of market activity instead of just a snapshot. As TbT charts capture all market activity, there is no data loss of trades on the exchange.
| TbT | Snapshot data |
| --
| --
- | --
- |
| CapturesEvery single trade executed at the exchange | **CapturesA limited snapshot view of trade flow |
| Volume Extremely large, requires colocated high-performance servers to process | **VolumeSmaller, manageable, less processing power required |
| Traditionally used by High-frequency traders, algorithmic trading systems, arbitrageurs, market makers | Traditionally used by Retail traders |
| Accuracy No data point is missed out ensuring that indicators, pattern recognition and price triggers are accurate | Accuracy Since Snapshot data captures limited trades per second it could lead to inaccuracies in the LTP |
👀** Visual Proof: TbT Charts vs.Snapshot Data Charts**
Let's take a peek at the 1-minute candlestick chart of Reliance from 10th Nov’23.
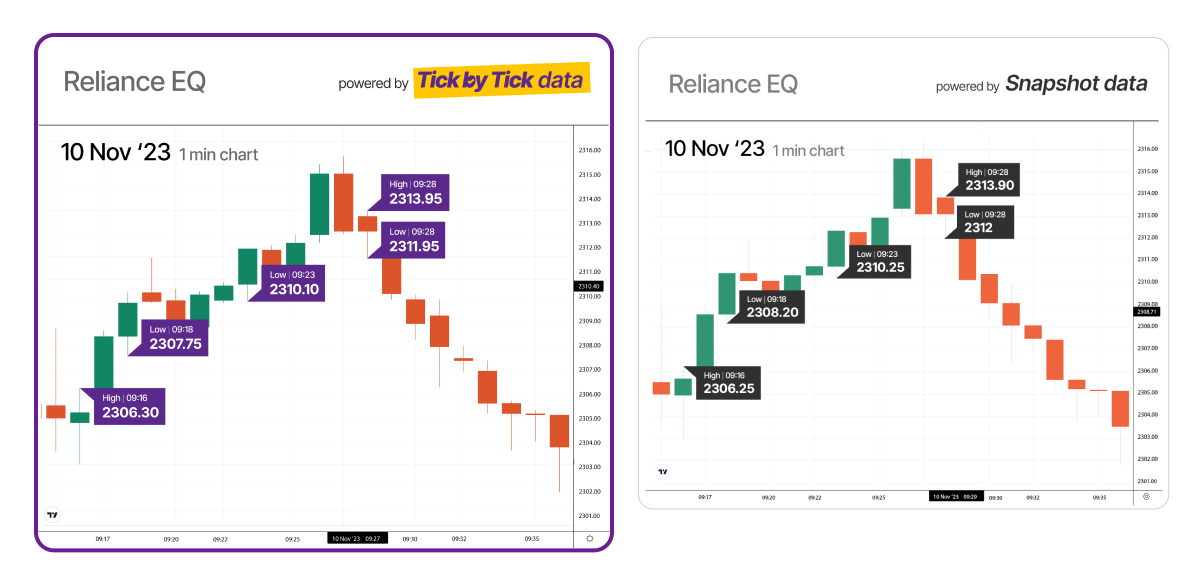
The highs are higher, the lows are lower – TbT charts tell the complete story. With TbT, no data point is left out, ensuring accuracy in indicators, pattern recognition, and price triggers.
💜Benefits of TbT Charting Data
TbT charting data enhances accuracy and improves all aspects of market analysis:
TbT charting data enhances accuracy and improves all aspects of market analysis:
-
Accuracy in every candle: Every candlestick on the TbT chart shows the most recent market activity, ensuring that you're working with the most up-to-date information available.
-
Precise indicators and patterns: TbT charts sharpen technical indicators and pattern recognition, making trading systems more reliable.
-
Reliable price triggers: Traders can create price triggers with confidence based on the most accurate market data available.
💡Upstox: Pioneering TbT Charting
Upstox is the 1st platform in India* to introduce TBT powered charts. Typically, accessing TBT data directly from the exchange is costly and requires complex setup, making it out of reach for most retail traders. However, Upstox has taken a significant step by providing free access to this highly accurate market data, putting retail traders on an equal footing with institutional and algorithmic traders.
TBT represents more than just an upgrade; it's a fundamental shift in trading. By offering real-time, precise data, we enable you to make well-informed decisions, armed with the same level of market insight as professional traders. These TBT charts are now accessible through both the Upstox app and the desktop platform. At Upstox, it's not just about trading, but trading with utmost precision.
Dive in, track, analyse, and trade in a market where every tick is pivotal to your success.