RSI: Gauging the pulse of the stocks

Objective
Traders are always on the lookout for tools that can help them identify the strength in the current trend and any early signs of trend reversals. RSI is one such powerful tool that traders must have in their armory.
Traders are always on the lookout for tools that can help them identify the strength in the current trend and any early signs of trend reversals. RSI is one such powerful tool that traders must have in their armory.
Introduction & Benefits of RSI
RSI stands for ** Relative Strength Indicator.** It is one of the first indicators used in technical analysis by investors to gauge the pulse of the stock. It measures the change in price momentum i.e. it measures the speed and magnitude at which a stock's recent price changes, in order to evaluate it as overvalued or undervalued conditions in the price of that stock. The investor will receive an early signal if the market is in overbought or oversold territory.
It is important to remember that a stock can continue to be more expensive even as the RSI is in the overbought territory or more cheaper as the RSI is in the oversold territory. RSI works best when the market is trending sideways. It is displayed as an oscillator i.e. a line graph, ranging from 0 to 100 levels.
How is RSI calculated? The default duration for the measurement of RSI is 14 days but can be adjusted to minutes, hours, days, weeks, or even months. It is calculated using the following formula:
RSI = 100 − [100/(1 + RS)]
Where, RS stands for Relative Strength. It is calculated using the following formula:
RS =Average close up ÷ Average close down
RS =Average close up ÷ Average close down
Average close up = Total gain per period ÷ duration
Average close down = Total loss per period ÷ duration
When to use RSI
RSI indicates not only if the stock is overbought or oversold conditions but also that the stock may be primed for a trend reversal or corrective pullback in price. Let's understand how to identify this:
-
RSI reading of 80 or above indicates that the stock is in overbought territory. This is often interpreted as a signal to go short as the prices are increasing and an opportunity to book profits.
-
RSI reading of 20 or below indicates that the stock is in oversold territory. This is often interpreted as a signal to go long for medium to long term investments as the prices are falling.
-
Within this range, the RSI generally moves in the direction of the price, however the pace of the movements could very well differ.
Note: Some traders prefer the 70-30 range for the RSI, instead of the 80-20.
Benefits of RSI
-
It is simple and easy to understand.
-
It helps to identify if a share is overbought, oversold or if a trend reversal is on the horizon.
-
It can provide investors with entry and exit signals.
-
It can be used in combination with other indicators to support trading strategies.
Limitations of RSI
-
RSI works with a lag, thus running a risk of missing out on a trending trade.
-
It ignores volume when it indicates key reversal levels.
-
There is no inference, when it is trading around level 50.
Scenarios & ApplicationCase Study 1: Stock 1
Let’s take an example: This is a daily chart of a leading car maker.
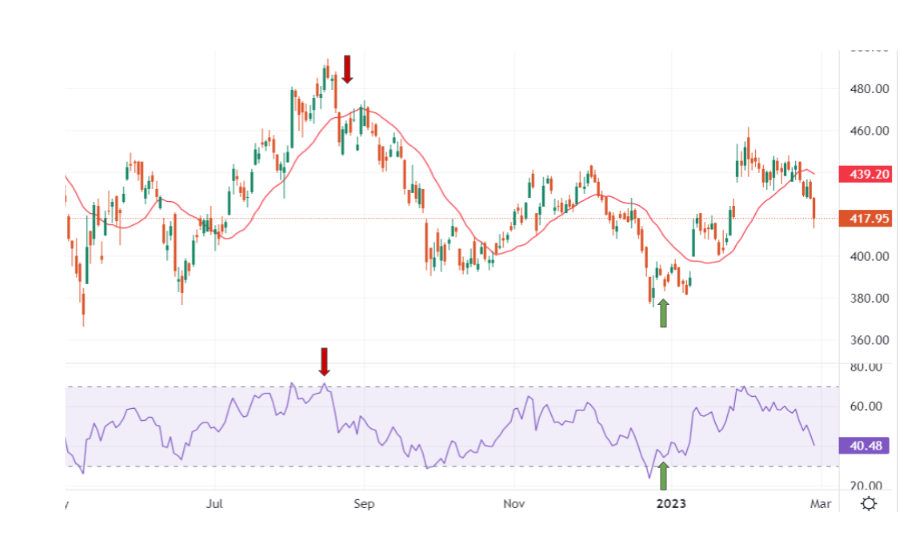
Source: TV charts on Upstox platform
Observe how the price went down from point ‘X’ when its RSI came near 80 (started declining from the overbought Zone) and later, Prices bounced back when its RSI came near 20 (from the oversold zone).
Thus a trader can attempt to enter at a relatively lower price where the risk is less compared to the potential reward and attempt to exit at a relatively higher price using RSI overbought and oversold signals.
Case Study 2: Index
The RSI can also be used to take positions in options. However, since options premium is dependent on the fluctuations in the underlying, it is advisable to study the underlying’s RSI rather than that of its option contract. Let's look at how we can set-up a trade on the index options based on the RSI reading of the index.
Here we see that the RSI of 83 indicates overbought conditions, and the index slipped lower. After hitting a closing high of 17,956, over the next few days it fell to 17,166.
Since the RSI is indicating an overbought situation, the index could possibly move downwards in price. A put option is a contract that gives the holder the right to sell at a certain price. With a put option strike of 17900, you could initiate a short position the index at this price on expiry and square it off at a lower price
- if the index does move downwards.
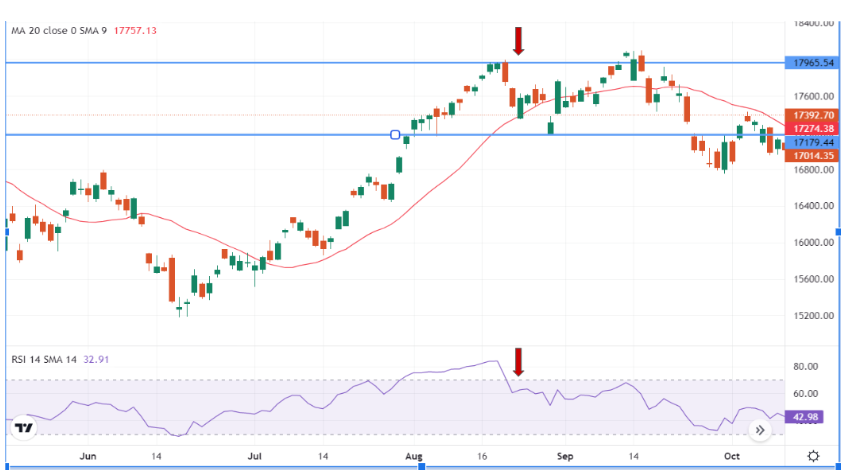
Source: TV charts on Upstox platform
An option contract's price is based on intrinsic value and extrinsic value. The underlying price impacts the options intrinsic value. The time remaining until the expiration of the option and the option's implied volatility determine the extrinsic value. The lowered index price resulted in the put option increasing in value.
But there are certain limitations of this trading system. The RSI for any stock or index can remain in an overbought or oversold zone for a long time when the stock/index is in a very strong trend (up or down). Also, one cannot look at this indicator standalone. Remember, it’s an indicator, so one must look at price patterns first and then look at RSI for confirmations.
Key Takeaways
-
RSI is a technical indicator used to measure the strength of a security's price action.
-
RSI values range from 0 to 100, with readings above 80 indicating overbought conditions and readings below 20 indicating oversold conditions.
-
RSI is often used in conjunction with other indicators and market analysis to make trading decisions.
-
RSI is a lagging indicator, meaning that it only provides information on past price action and may not be as useful in predicting future price movements.
-
It can be affected by volatility, which can skew its readings.
-
It is based on closing prices, so traders may miss important intraday movements.
Whats Next
Trader’s often club RSI with other indicators like MACD. To learn more about MACD, click here.
Trader’s often club RSI with other indicators like MACD. To learn more about MACD, click here.
Disclaimer
Investments in the securities market are subject to market risk, read all the related documents carefully before investing. The securities quoted are exemplary and are not recommendatory. To know more visit https://upstox.com/
Derivatives trading must be done only by traders who fully understand the risks associated with them and strictly apply risk mechanisms like stop-losses. The information is only for consumption by the client and such material should not be redistributed. We do not recommend any particular stock, securities and strategies for trading. The stock names mentioned in this article are purely for showing how to do analysis. Take your own decision before investing.