How to Identify Entry and Exit Points in Intraday Trading

Overview
Like in many other things we do, even in stock trading, well begun is half done. The profit or loss you make in a trade depends a lot on the price at which you enter the trade. Similarly, trading profit is real only when it is realised i.e. when the trade is exited. In this blog, we will discuss various ways to identify entry and exit points.
Entering a trade
Whether you trade in equity shares, ** futures or options**, the research is usually based on the underlying stock or index. And, technical analysis is one of the preferred ways to identify entry and exit points. Technical analysis involves the study of price charts. Here are some simple ways to identify entry points in a trade.
1. Breakout
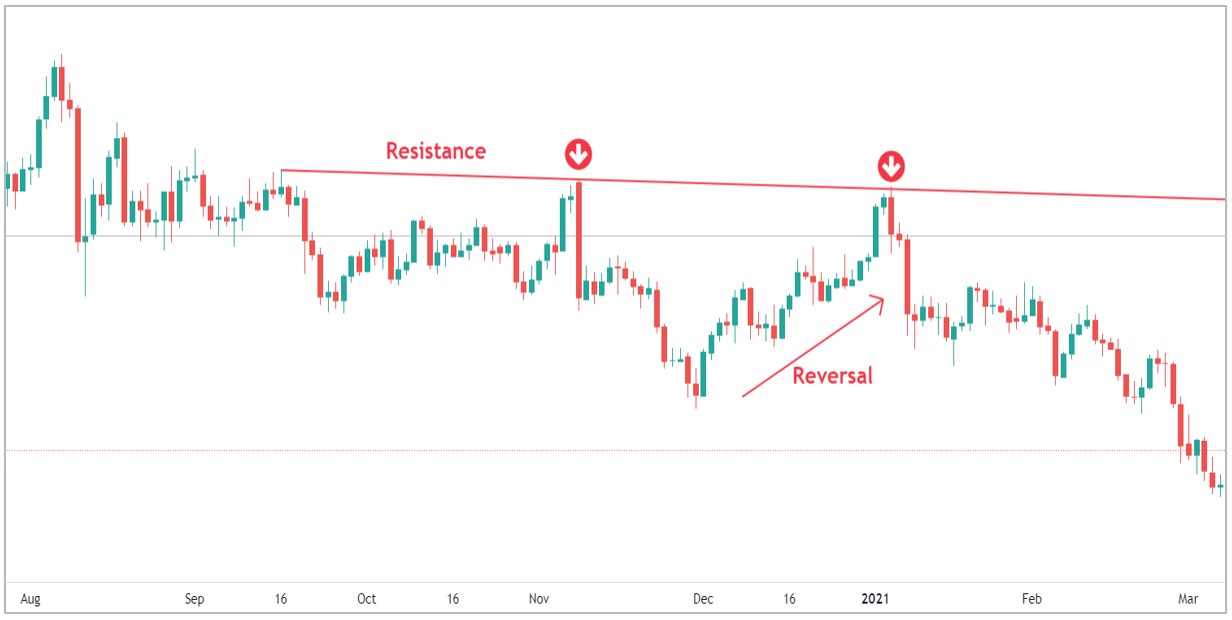
To understand ** breakout**, let’s first learn the concept of resistance. Simply put, resistance is the level at which the stock price faces pressure on its way up. Typically, the stock price is not able to easily move above it. This happens because of the high number of sellers at that price level.
Resistance
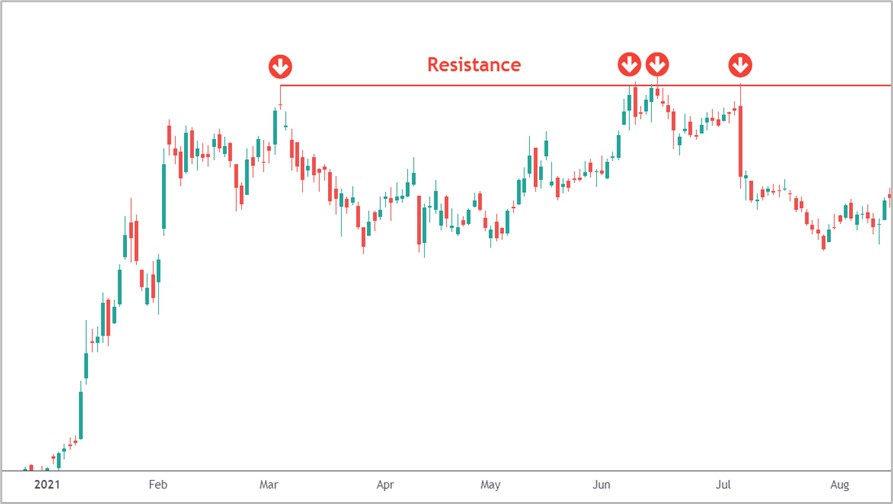
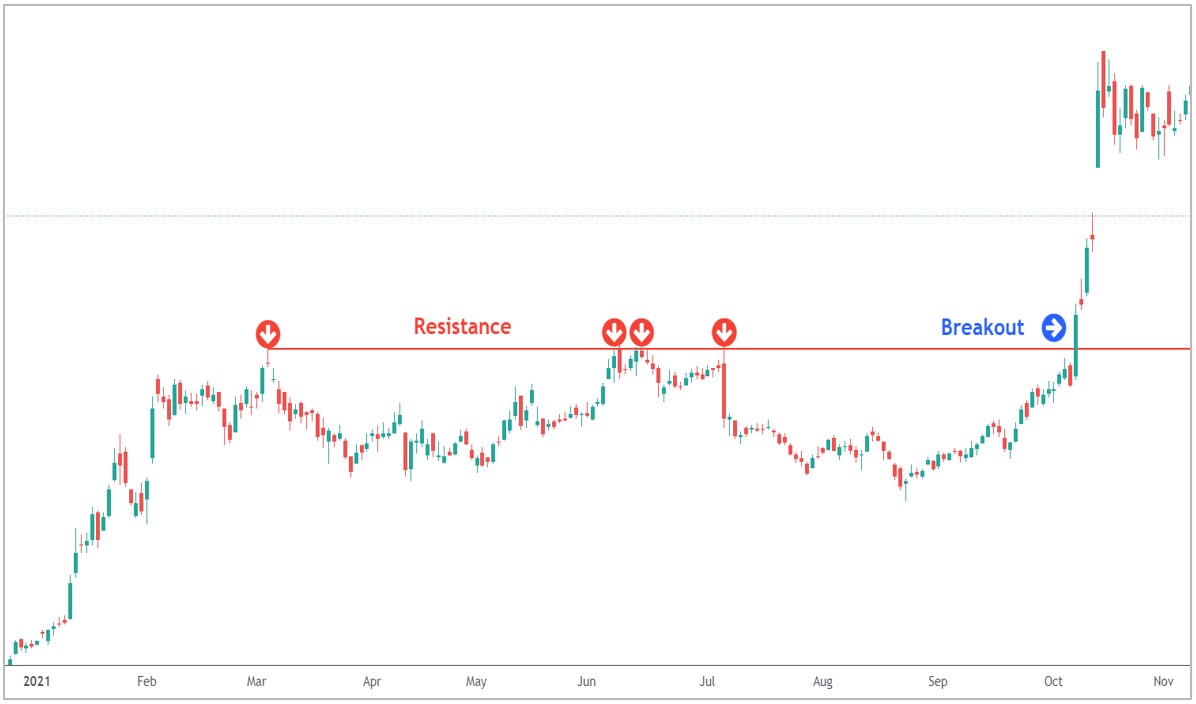
A breakout happens when the price crosses the resistance and moves above it. It indicates the strength of bulls over the bears and signals an opportunity to buy, or go long.
Breakout of Resistance
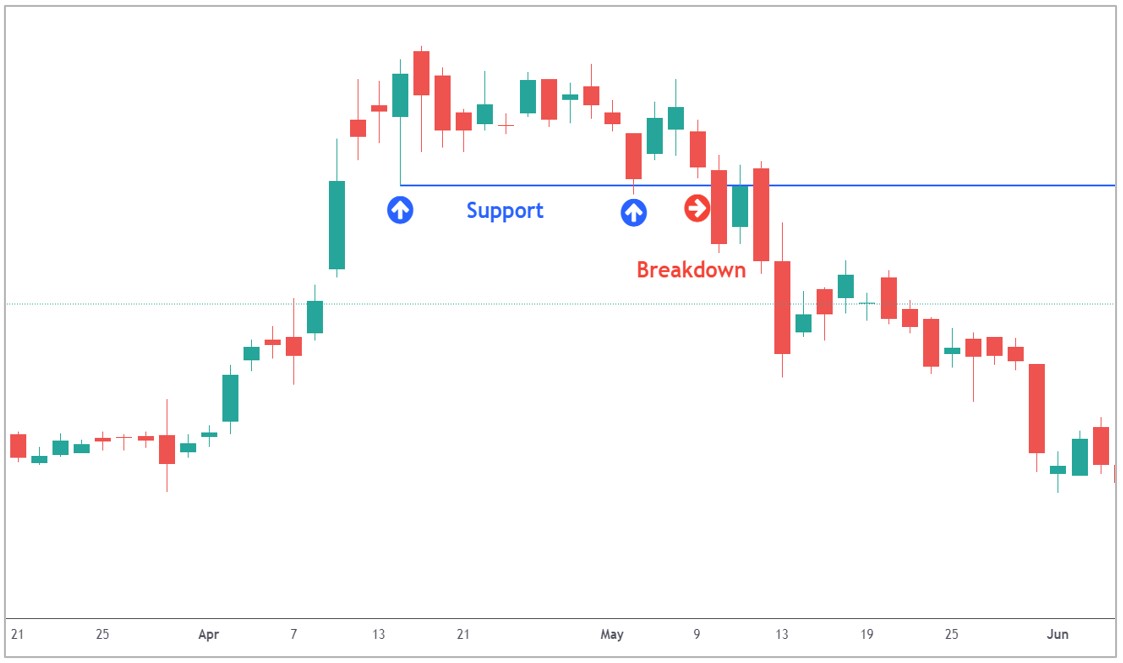
Contrast this with a breakdown of support, which creates an opportunity to go short.
Breakdown of Support
 ## **2. Pullback to support**
Now, as you are aware, markets never rise in a straight line. A rise is followed by a minor correction or pullback. At times, during the pullback, the stock could come down to its support.
Support is the level at which the falling stock price sees fresh buying interest. Thus, the price is not able to easily move below it. These support lines could be horizontal or upward sloping.
Pullback to Support
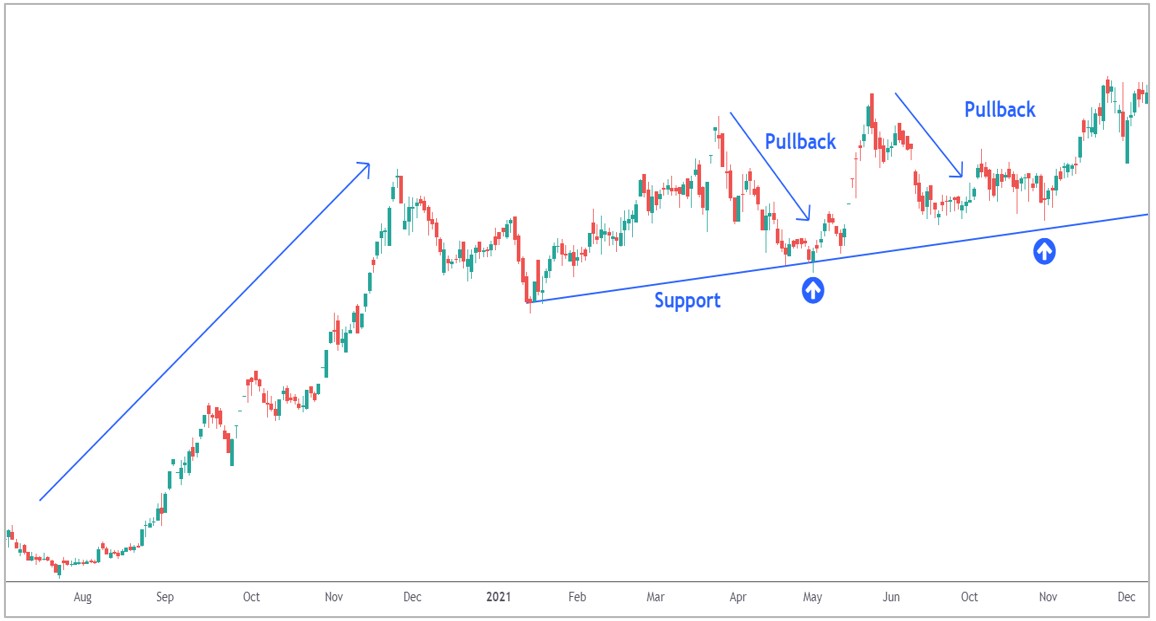
The pullback to support creates an excellent buying opportunity. This is because the stock is already in an uptrend and the pullback to the support creates a possibility of a fresh up trend.
Similarly, a reversal to a resistance creates an opportunity to enter a short trade.
Reversal to Resistance
 ## **3. Open interest data**
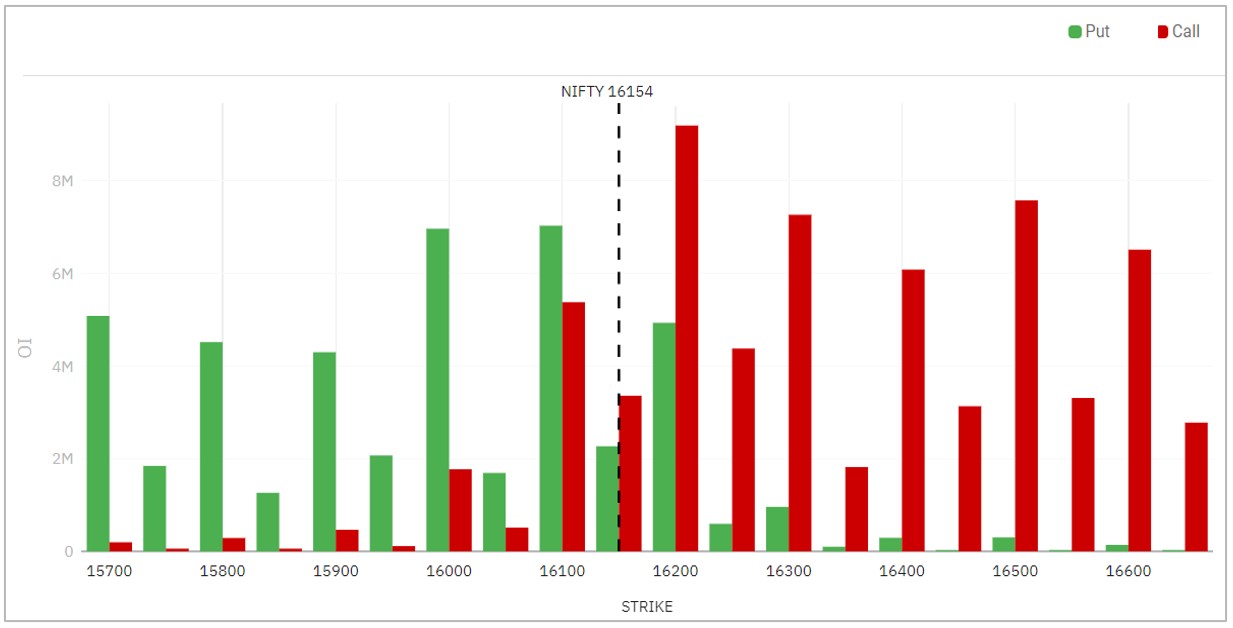
Options traders use the open interest build-up data to identify support and resistance levels, which in turn could become buying and selling zones.
For a call option, a huge open interest (OI) at a certain level indicates a possible resistance level e.g. 16,200 in the below image. In contrast, for a put option, high OI signifies a possible support level at that strike price, e.g. 16,100.
Open interest data
 ### **Exiting a trade**
Just as identifying the right entry point is critical in trading, it is also important to know when to exit. Here are some of the ways to find an exit or target price.
1. Targets using price patterns
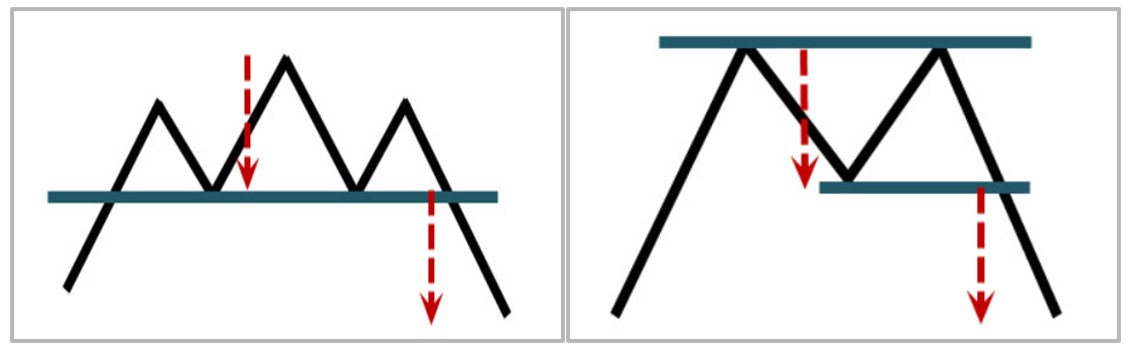
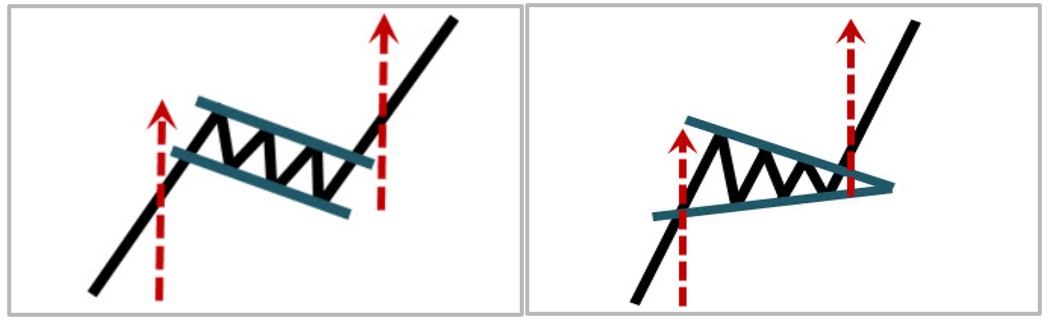
Technical price patterns such as head and shoulders, ** double top/bottom**, flag, pennant, etc. help to find an exit price. The price targets can be calculated by measuring the height of the pattern and then adding it to (or subtracting it from) the breakout or support price.
Head and shoulders Double top
Flag Pennant
 ## **2. Swing low and tops**
Normally, one would think of exit price only in terms of profit targets. However, a trader must also have a plan B in place in case the trade goes wrong. You can do that by setting a ‘stop loss’. A ** stop loss** is nothing but an advance order to exit a trade when it reaches a particular price point. This is especially helpful in limiting losses.
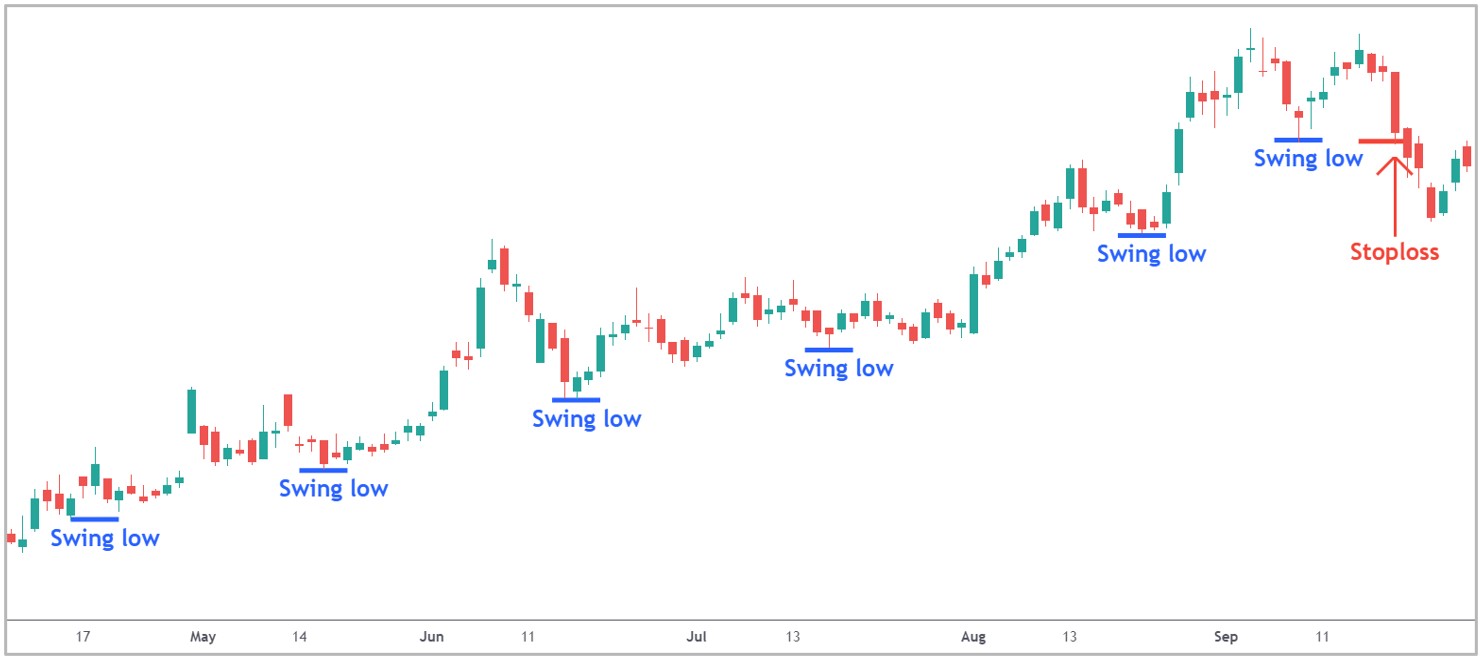
Most professional traders keep it simple when deciding the stop loss price. They keep their stop losses below a swing low in case of a long trade or above a swing high in a short trade. These work well because a break of the swing serves as the first indication of a change in the trend.
Swing lows as stop loss
 ## **3. Risk-to-reward ratio**
Traders could also decide on a Risk-to-reward ratio (RRR) to calculate their exit price. Generally, ** intraday traders** prefer a RRR of 1:1. Using this, the exit price can be calculated as below:
Entry price = 100
Stop loss = 95
Risk amount (Entry
Entry price = 100
Stop loss = 95
Risk amount (Entry
- Stop loss) = 5
Target (Entry + Risk) = 105
Similarly, delivery traders would prefer a higher RRR, say 1:2 or 1:3, given the risk of overnight gap-up and gap-down opening. Exit price based on a 1:3 RRR could be as below:
Entry price = 100
Stop loss = 95
Risk amount (Entry
Entry price = 100
Stop loss = 95
Risk amount (Entry
- Stop loss) = 5
Target (Entry + Risk) = 115
While these are some of the ways to identify entry and exit points, this is not an exhaustive list. Choose a method/s based on your risk appetite, past experience and comfort levels.