Bull Market Strategies - Protective Put and the Long Call
Bull Market Strategies
- Overview
There is a lot of talk of 2013 being a "bull market" year. Reports that India will open the gates for FDI, political parties speeding up decisions and heavy investment in critically needed areas have pushed the Nifty from around 4,600 at the beginning of 2012 to close to 6,000 towards the end. Are we already in the bull market or is it just the beginning as the reports claim to say? Well, let's say that you foresee a bullish trend for the coming months but maybe not immediately. Let's learn about bull market strategies that pays you money in a rising market and hedges you for a neutral market.
Protective Put Strategy
Strategy: Buy 1 Lot of Future/Equity + Buy 1 Lot of ATM Put
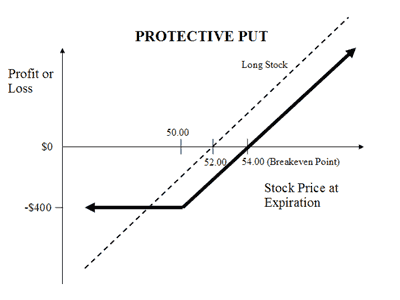
A protective put strategy involves buying 1 lot of the underlying and 1 lot of at-the-money put option. It is a type of synthetic long call. Use it when you see the market going upwards but want to protect yourself from short term losses. If you are already long on the underlying buy the put to secure yourself from potential losses but still leaving yourself with unlimited profit potential. Let's see an example of this used with the Nifty. Here's a protective put call payoff graph:
[caption id="attachment_368" align="aligncenter" width="300"] A protective put payoff graph[/caption]
 A protective put payoff graph[/caption]
Say I bought Tata Motors Jan Future and Tata Motors Jan Put 320 (At The Money) on January 1st. This is how my profit potential plays out from Jan 1 through Jan 24. [You can pull end of day (EOD) prices up at http://nseindia.com/index_nse.htm by typing the stock symbol on the top and pressing "Get Quote."]
On Jan 1st, I bought 1 lot (1000 shares) TataMotors Jan Fut at Rs. 318.90 and 1 lot of TataMotors Jan 320 PE at Rs. 11.65. Here's what the results would look like during 24 days.
[table id=40 /]
At the end of the 24 days, my put option made Rs. 15.85 (in reality it is Rs. 15.85 * 1000, but for simplicity's sake we will keep all numbers at a per share level), while my future lost Rs. 26.05 totaling to a loss of Rs. 10.20. While we are still at a loss, it is good to know that if we didn't hedge our position using a protective put, we would have been down Rs. 26.05 instead of just Rs. 10.20.
Now here's the kicker -
- this is the same exact payout as going on a Long Call. The protective put is known as a Synthetic Long Call because of this shared attribute. Take a look at the next strategy in our Bull Market Strategies series -
- a standard long call.
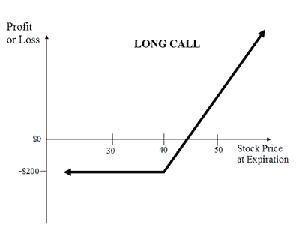
Long Call
Strategy: Buy 1 Lot of ATM Call
The payoff graph is identical to the protective put strategy above:
[caption id="attachment_369" align="aligncenter" width="300"] A long call payoff graph[/caption]
 A long call payoff graph[/caption]
Let's say that instead of the protective put strategy, I execute a long call. That is, on Jan 1st, I buy 1 lot of TataMotors Jan 320 CE at Rs. 10.45. Here's what the results would look like:
[table id=41 /]
Notice that at the end of the 24th day, my total P&L is a loss of Rs. 9.85. Not too far from the protective put strategy up above.
Conclusion
While both bull market strategies have similar payout graphs, there are some key differences and uses to note:
-
Use the protective put strategy if you already own shares and want to hedge against it
-
The long call strategy requires less margin than the protective put strategy
-
Even after the options expire, the protective put strategy leaves you with shares on hand if you bought equity
-
Transaction costs for the protective put strategy are higher than the long call strategy by itself
Use either strategy if you think the market is bound to go up even more in the coming months. You can look at picking up futures and options that expire later down in the year if you want to give yourself a longer timeframe. There are more bull market strategies that help investors make money during a market run. We will cover those later.