2012 Stock Market: A quick look back
[caption id="attachment_282" align="aligncenter" width="300"] Nifty's movement in 2012[/caption]
 Nifty's movement in 2012[/caption]
2012 Stock Market
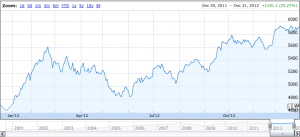
We all know markets are very unpredictable. In 2012 the Nifty saw a range of 4,588
- 5,919 (graph here). That is about 1,331 points or 29% increase from the years low. Interestingly enough, the years low came on 02/01/2012 on the first day of last year, and the years high was on 31/12/2012, the last trading day of the year.
During 2012, the Nifty broke many resistances but failed to break 5,940 which seemed to be the biggest hurdle in the Bull run.
How markets will perform in 2013
As the year 2012 was overall in an uptrend, 2013 may continue to be same and I predict that we will see new highs for the Nifty. Nifty started the year strongly breaking the resistance of 5,940 on 01/01/2013 (currently @ 6016). Some important levels to watch are 6,070, 6,180 and 6,312 on the higher side. Also, 5,940 and 5,730 are the levels to watch on the lower side.
Investors can be bullish this year with proper levels to watch. My prediction is that the 5,730 point is a very crucial level for a trend reversal. Though it seems that the upside is limited to 300 points and a bit difficult (300 points puts the Nifty at approximately 6,312), it definitely has a chance to see new highs in 2013.
The all-time high, 6,312 is also a very tough resistance to break as it will create a triple top. But as the current government will present its last budget before the next elections in 2014 we might see good things coming up for the market and new highs for the Nifty.
Keep watching...
Note: All supports or resistances are given on closing basis.