
Help Center

Getting Started
Trading
My Account
Mutual Funds
IPOs
Stock SIP
Gold
NPS
Government Securities
Fixed Deposits
Insurance
Loan
Smallcase
DartStock
Upstox API
NCD
US Stocks
Understanding XIRR (Extended Internal Rate of Return)
What is portfolio XIRR, and how is it calculated?
Introduction to XIRR
XIRR, or the extended internal rate of return, is an effective way to measure the growth rate of regular investments over an extended period. It is useful for calculating the annual growth rate of multiple stock or mutual fund investments running for several years.
For example, in a SIP or staggered investment, you invest small amounts of money at intervals instead of putting a lump sum at once. The XIRR calculation considers all these periodic transactions along with the date at which they are executed and their current value to give you a consolidated rate of return.
Why is XIRR required for portfolio assessment?
Calculating returns for regular investments in stocks and mutual funds presents unique challenges. Whether you're making scheduled purchases (like SIPs), periodic lump sum investments, or irregular additions to your portfolio, you'll encounter multiple investment points at different purchase prices across varying intervals.
Additionally, your investment journey may include inflows from dividends or outflows from partial redemptions. In such a complex scenario, XIRR serves as the most reliable financial metric to accurately calculate your returns at any given point in time.
XIRR treats each transaction as a distinct cash flow, properly accounting for both the amount and the specific duration for which each investment remains in your portfolio. This approach provides a much more accurate picture than simplified metrics like absolute returns.
For example, suppose you have been investing in a stock or mutual fund for 5 years through multiple transactions. XIRR calculation will account for the fact that your earliest investment has been working for the full 5 years, while subsequent additions have spent progressively less time in the market. Similarly, any dividends received or partial redemptions made along the way will also be properly accounted for at their exact dates.
This makes XIRR the most accurate way to evaluate the performance of any investment strategy involving multiple transactions over time, whether in stocks, mutual funds, or a combination of investment vehicles in your portfolio.
How XIRR differs from absolute returns and CAGR?
Absolute returns or simple returns measure the net gain or loss in a portfolio while ignoring the time value of money. It is more suited for lump sum investments.
Example:
1. You invested ₹5,000 in January 2023
2. And invested ₹5,000 in December 2024
3. The current value of the investment in April 2025 is ₹14,000
In this case:
Absolute returns = (Final value - Initial value)/Initial value = (14,000 - 10,000)/10,000 = 40%
You have invested for over three years. So naturally, you would like to know how your investment grew every year. Absolute return doesn’t tell you that.
Therefore, absolute return does not give a clear picture when multiple investments are involved. In this situation, even CAGR, or the compounded annual growth rate, will not be very helpful.
CAGR is the average annual return that an investment has generated over a period. It is the rate at which your investment grows yearly during the investment period, assuming profits are reinvested at the end of each year.
Example:
1. You invested ₹5,000 in January 2023
2. And ₹5,000 in December 2024
3. The current value of investment in April 2025 is ₹14,000
In this case:
CAGR = [(Final Value / Initial Value)^(1/n)] - 1
CAGR = [(14,000/10,000)^(1/2.25)]-1= 15.7%
CAGR calculation tells you that the yearly growth rate of your investment is 15.7%. However, it doesn’t account for the separate investments made on different dates. For instance, the ₹5,000 that you invested in January 2024 may not have fetched the same number of units of a mutual fund or a company’s shares as it did in December 2024. And these investments may have performed differently.
Therefore, another metric is required to get a clear picture in situations where multiple investments are made over an extended duration. This is where XIRR comes in.
XIRR takes into account the different time intervals in which investments were made, thereby making it more suitable for periodic investments.
Example:
1. You invested ₹5,000 on January 1, 2023
2. And ₹5,000 on August 1, 2024
3. The current value of the investment on April 1, 2025 is ₹14,000
4. XIRR = 24.6%
How portfolio XIRR is calculated on Upstox (step-by-step)?
The formula to calculate XIRR is very complex. If you are not scared of maths, you may have a look at it below:
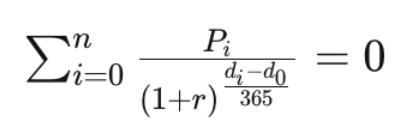
Scared? You can ignore the XIRR formula as it is easy to calculate on a spreadsheet using the XIRR function.
The following are some steps used for calculating XIRR on Upstox:
1. For each fund or scrip, all the transactions are fetched (including historical transactions). If the first transaction in the fund is less than a year old, then XIRR is shown as NA.
a. All investment values are marked as negative (money that is going into investments)
b. All Sell transactions or redemptions are marked as positive (money taken out of investments)
c. Current holdings are plotted in the last row
d. Corporate actions like dividends, stock splits and bonus issues are also accounted for
2. The cash flows are sorted in ascending order of dates
3. The XIRR function is then applied using a spreadsheet
Portfolio level XIRR is then calculated by aggregating the data for each stock and mutual fund.
Sample scenarios for XIRR and returns calculation
Portfolio with regular investments (SIP)
An example of a user who makes quarterly investments for 1 year
| Transaction Date | Transaction Type | Units Bought/Sold | Amount (₹) |
|---|---|---|---|
| Jan 1, 2024 | Buy | 100 | -25,000 |
| Apr 1, 2024 | Buy | 100 | -25,000 |
| Jul 1, 2024 | Buy | 100 | -25,000 |
| Oct 1, 2024 | Buy | 100 | -25,000 |
| Jan 1, 2025 | Current Portfolio | 110,000 |
XIRR = 16.2%
Absolute Returns = (Current Value - Invested Value)/Invested Value
Current Value = ₹1,10,000
Invested Value = ₹1,00,000
Therefore, Returns = (1,10,000 - 1,00,000)/1,00,000 = 10%
Portfolio with regular withdrawals:
An example of a user who made an initial investment and did partial withdrawals for 1 year
| Transaction Date | Transaction Type | Fund Value (₹) | Units Bought/Sold | Amount (₹) |
|---|---|---|---|---|
| Jan 1, 2024 | Buy | 1,000 | 100 | -1,00,000 |
| Apr 1, 2024 | Sell | 1,200 | 25 | +30,000 |
| Jul 1, 2024 | Sell | 1,000 | 20 | +20,000 |
| Oct 1, 2024 | Sell | 1,200 | 15 | +18,000 |
| Jan 1, 2025 | Current Portfolio | 1,400 | 40 | +56,000 |
XIRR = 36.7% [All Buy and Sell transactions considered)
Absolute Returns on Portfolio Card (Current Holdings)
Invested Amount + 40 * ₹1,000 = ₹40,000
Current Amount = ₹56,000
Returns = 40%
Portfolio with negative XIRR but positive returns:
An example of a user who does quarterly investments but also makes redemptions in between
| Date | Transaction Type | Fund Value (₹) | Units Bought/Sold | Amount (₹) |
|---|---|---|---|---|
| Jan 1, 2024 | Buy | 1,250 | 20 | -25,000 |
| Apr 1, 2024 | Buy | 1,388 | 18 | -25,000 |
| Jul 1, 2024 | Buy | 1,666 | 15 | -25,000 |
| Oct 1, 2024 | Buy | 1,666 | 15 | -25,000 |
| Nov 1, 2025 | Sell | 1,000 | 60 | +60,000 |
| Jan 1, 2025 | Final Valuation | 2,000 | 8 | +16,000 |
XIRR= -19.17% [All Buy & Sell transactions considered)
Absolute Returns on Portfolio Card (Current Holdings)
Invested Amount = 8 * ₹1,250 = ₹10,000
Current Amount = ₹16,000
Returns = 60%
Portfolio with positive XIRR but negative returns:
Another example of a user who did an initial lump sum investment but made quarterly redemptions (SWP)
| Date | Transaction Type | Fund Value (₹) | Units Bought/Sold | Amount (₹) |
|---|---|---|---|---|
| Jan 1, 2024 | Buy | 1,250 | 100 | -125,000 |
| Apr 1, 2024 | Sell | 1,260 | 25 | 31,500 |
| Jul 1, 2024 | Sell | 1,300 | 25 | 32,500 |
| Oct 1, 2024 | Sell | 1,300 | 25 | 32,500 |
| Nov 1, 2025 | Sell | 1,350 | 20 | 27,000 |
| Jan 1, 2025 | Final Valuation | 1,200 | 5 | 6,000 |
XIRR= 4.54% [All Buy & Sell transactions considered)
Absolute Returns on Portfolio Card (Current Holdings)
Invested Amount = 5 * ₹1250 = ₹6,250
Current Amount = 5 * ₹1,200 = ₹6,000
Returns = -4%
FAQs
Why is my portfolio XIRR positive but has negative overall returns?
An investment portfolio can show positive XIRR but negative overall returns. It happens because the overall return calculation takes into account the total amount invested and the final value over the investment period. In contrast, XIRR calculates returns based on factors such as cash flows and dates of investments/withdrawals.
For instance, if you make multiple withdrawals during a period of positive returns, the XIRR might reflect those gains, even though the total value of the portfolio declines due to withdrawals.
Why is my portfolio XIRR negative but has positive overall returns?
It is possible in some situations because of the way XIRR is calculated. For instance, suppose your portfolio has recovered from losses in a market recovery. In this situation, your overall portfolio returns may be positive while the XIRR may be negative due to earlier underperformance. The timing of investment is also crucial for XIRR.
XIRR doesn't account for unrealised gains, which might make your portfolio return positive, but a negative XIRR return.
In case your portfolio includes short-term investments, XIRR may not capture the overall growth of such investments accurately.
When is XIRR helpful?
XIRR helps calculate returns of a portfolio where multiple transactions, including withdrawals, are involved over a long period. It is especially helpful for SIPs.
Why is my XIRR showing NA?
If investments are for less than a year, then XIRR would be greater than the actual return. But this is not the right way to measure returns. Therefore, NA is displayed in portfolio XIRR. In such a situation, absolute return is more meaningful.
What should I look at in my portfolio: XIRR, CAGR or absolute return?
It depends on what you want to know. Absolute return will give you total returns over the investment period. It is useful in the case of a lump sum investment. However, CAGR will be helpful if you want to know the yearly growth rate of your lump sum investments. XIRR will give you the annual growth rate for multiple investments over a long period.
Is portfolio XIRR more reliable than CAGR or absolute returns?
Yes. A typical investment portfolio includes multiple transactions over several years. XIRR calculation will account for all such transactions and give a clear picture of how your portfolio is performing. However, please note that XIRR accounts for realised gains or losses only. Unrealised gains and losses are not accounted for in the XIRR calculation.
Trade with Upstox
Want to open a Demat account?
Open a FREE Demat and Trading account to invest in Stocks, Mutual Funds, IPOs and more.
By signing up you agree to receive transaction updates on Whatsapp. You may also receive a call from an Upstox representative to help you with the account opening process.
Upstox Community
Upstox Community
| Topic | Replies | Views | Activity |
|---|