
Help Center

Getting Started
Trading
My Account
Mutual Funds
IPOs
Stock SIP
Gold
NPS
Government Securities
Fixed Deposits
Insurance
Loan
Smallcase
DartStock
Upstox API
NCD
US Stocks
How do I add drawing tools, indicators, and open interest (OI)data in Chart 360?
To add drawings and indicators, follow these steps:
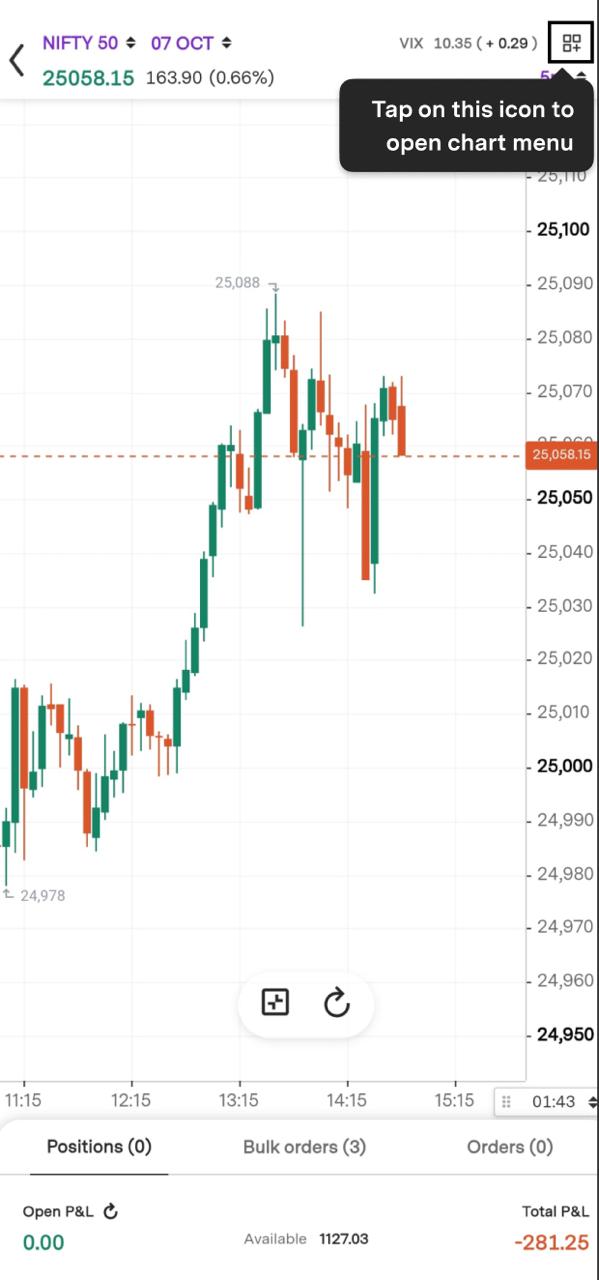
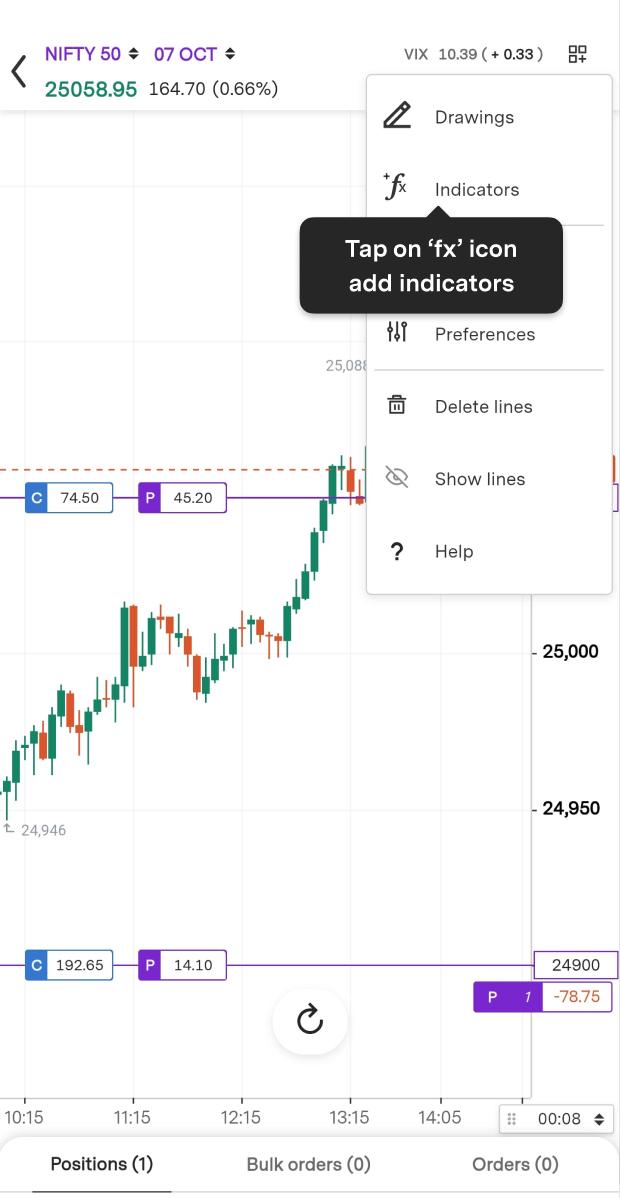
Step 1: Click on the launcher icon to open the chart menu.
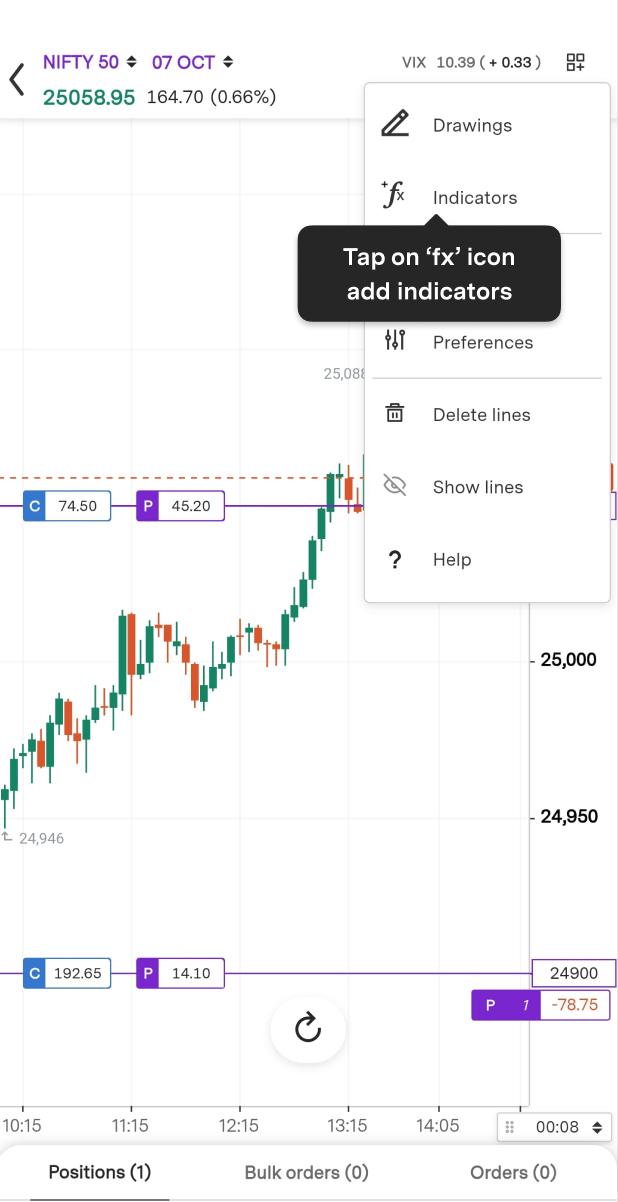
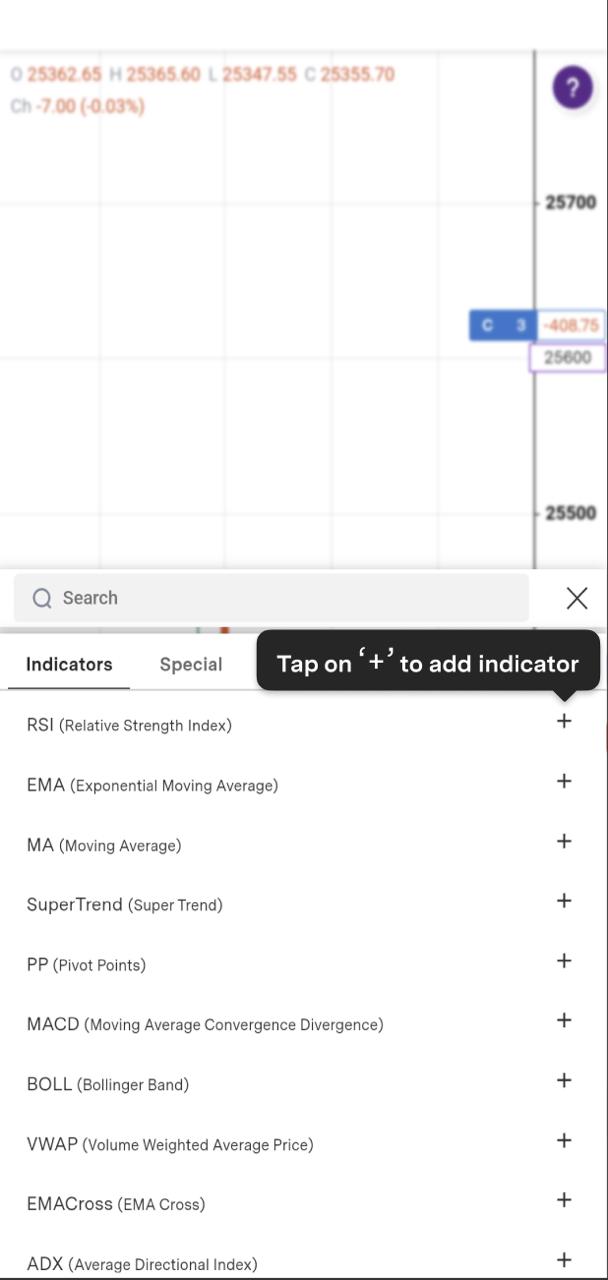
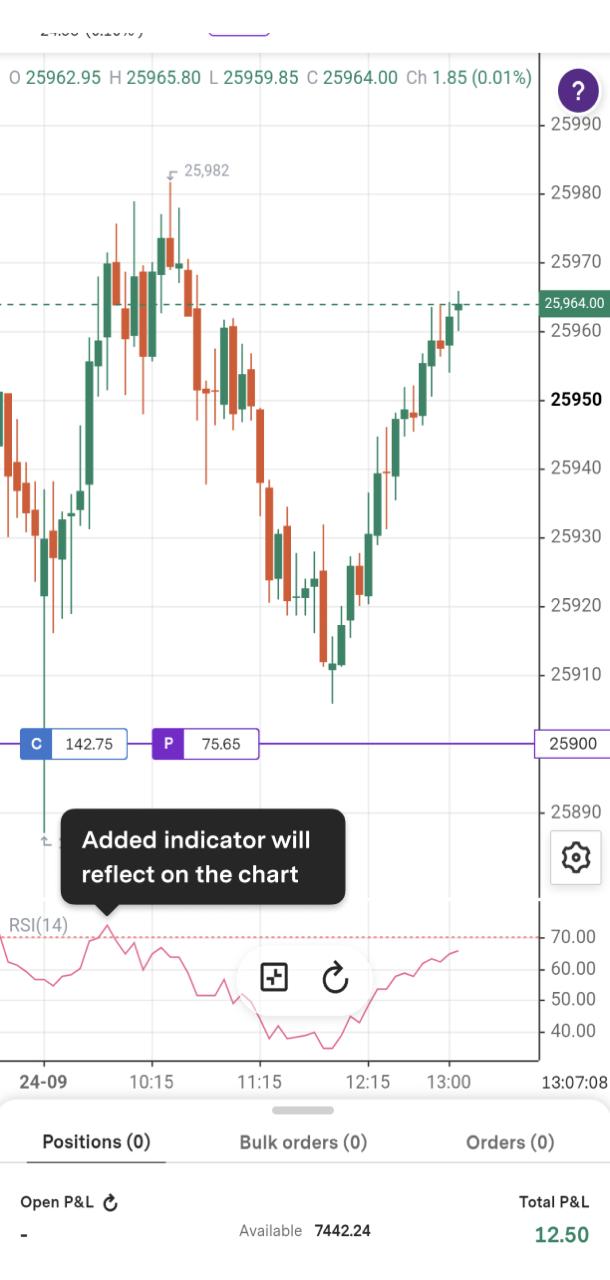
Step 2: Click on the Fx button and tap the ‘+’ icon to add an indicator.
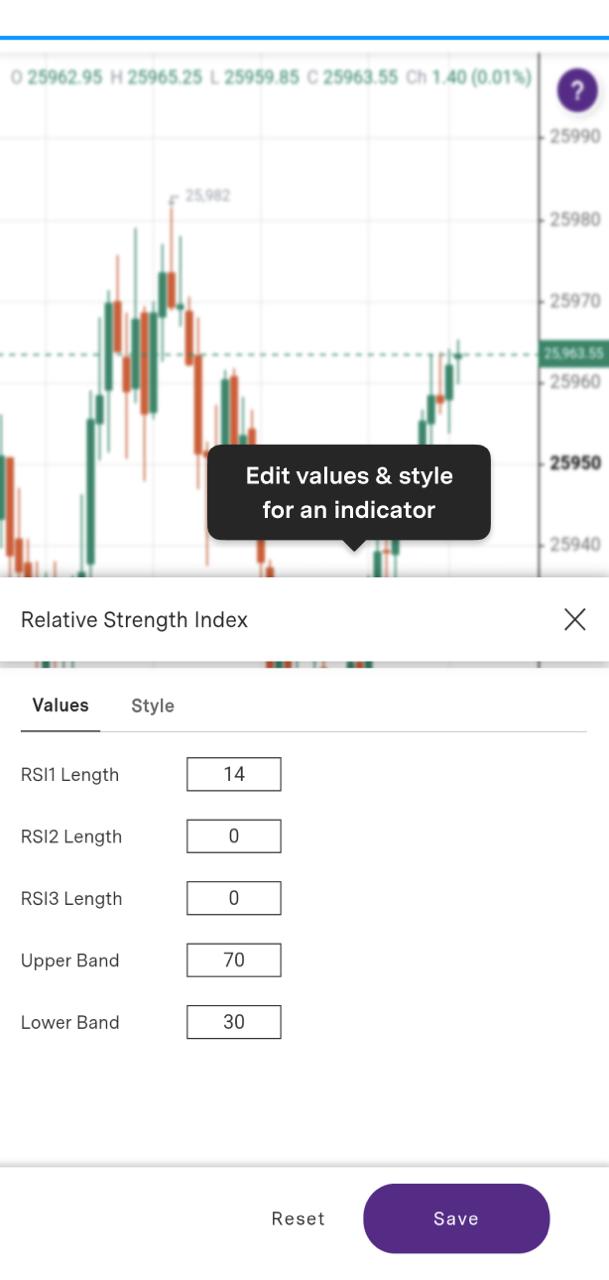
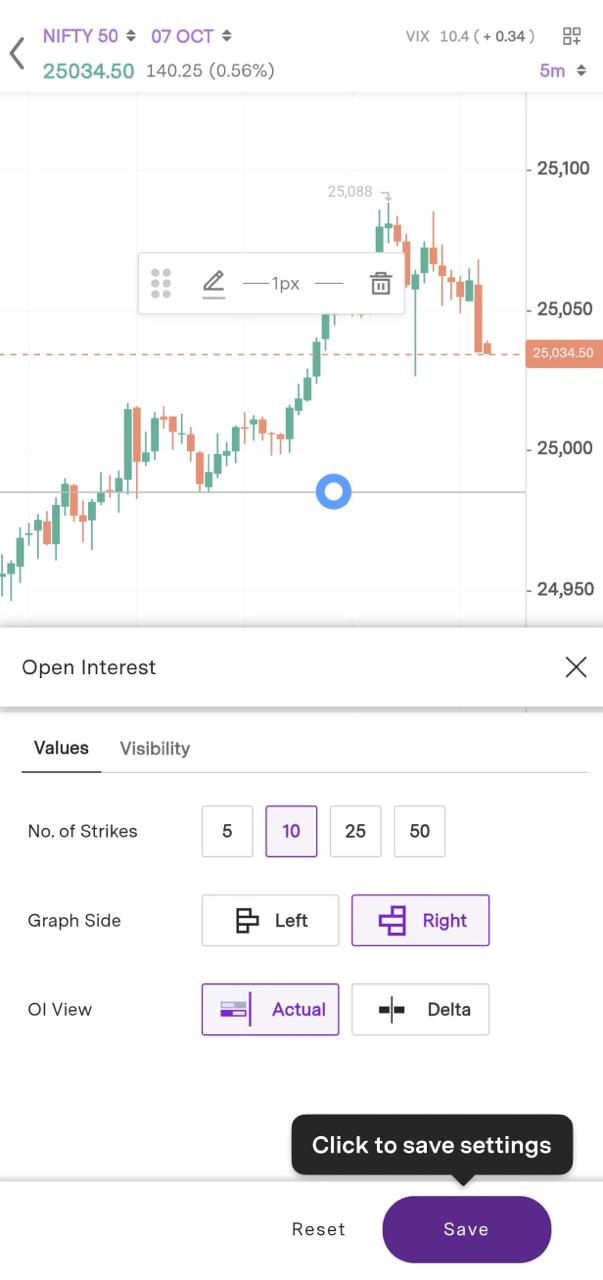
Step 3: Customise the values and style for this indicator by adjusting the settings to match your preferences.
Step 4: The indicator will be displayed on your chart.
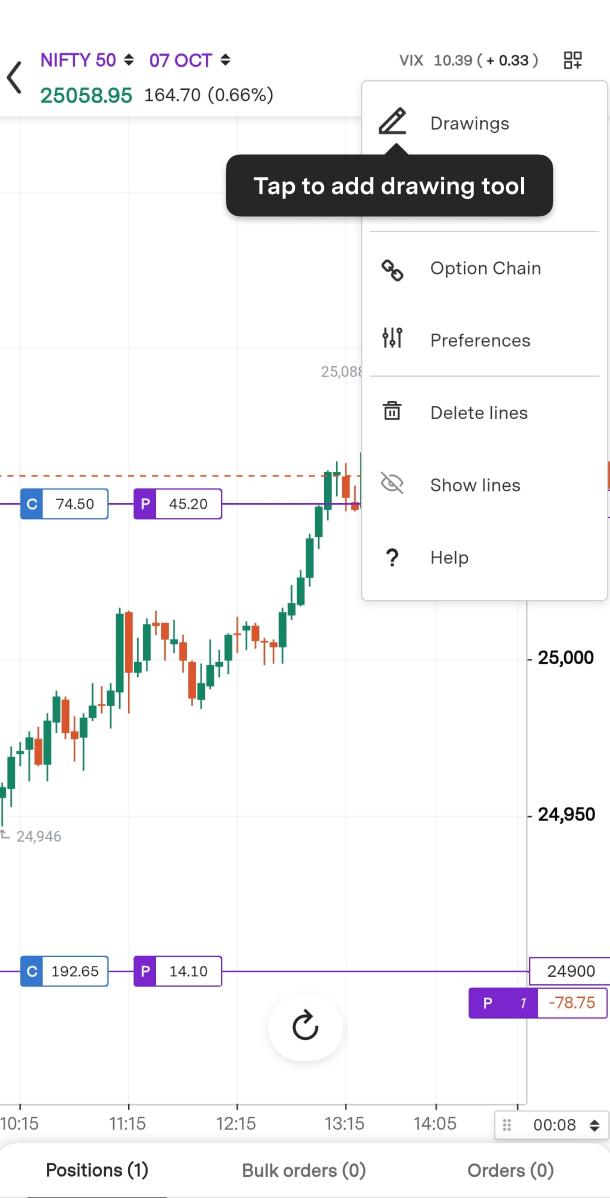
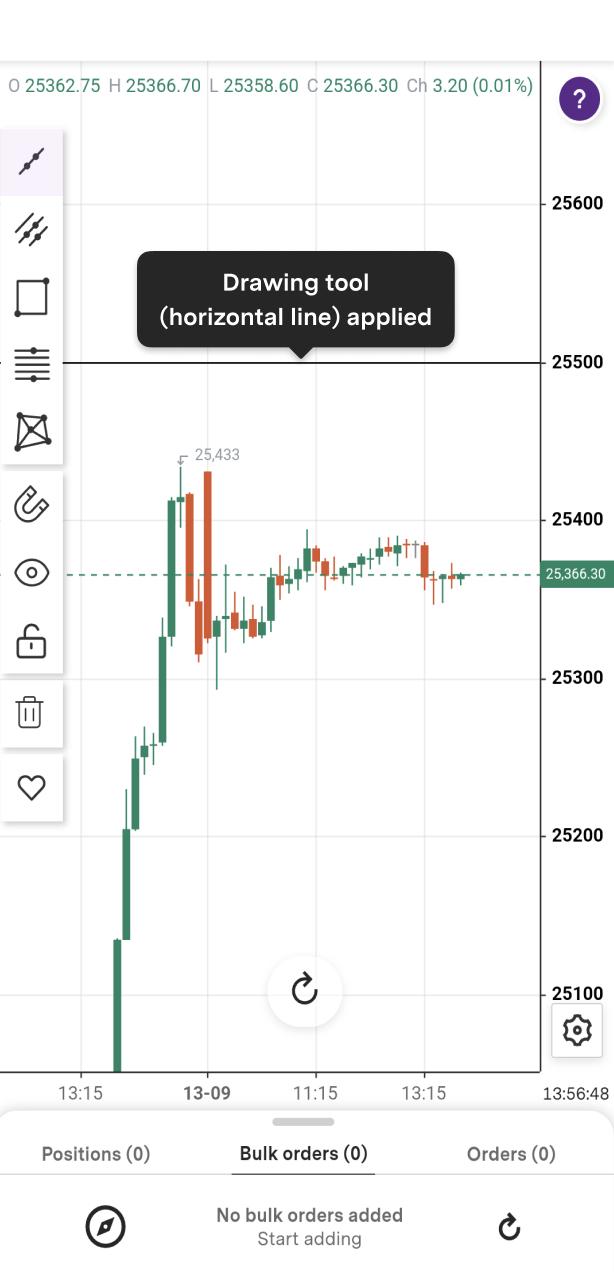
Step 5: To add drawings, tap on the Pencil icon or the drawing tool.
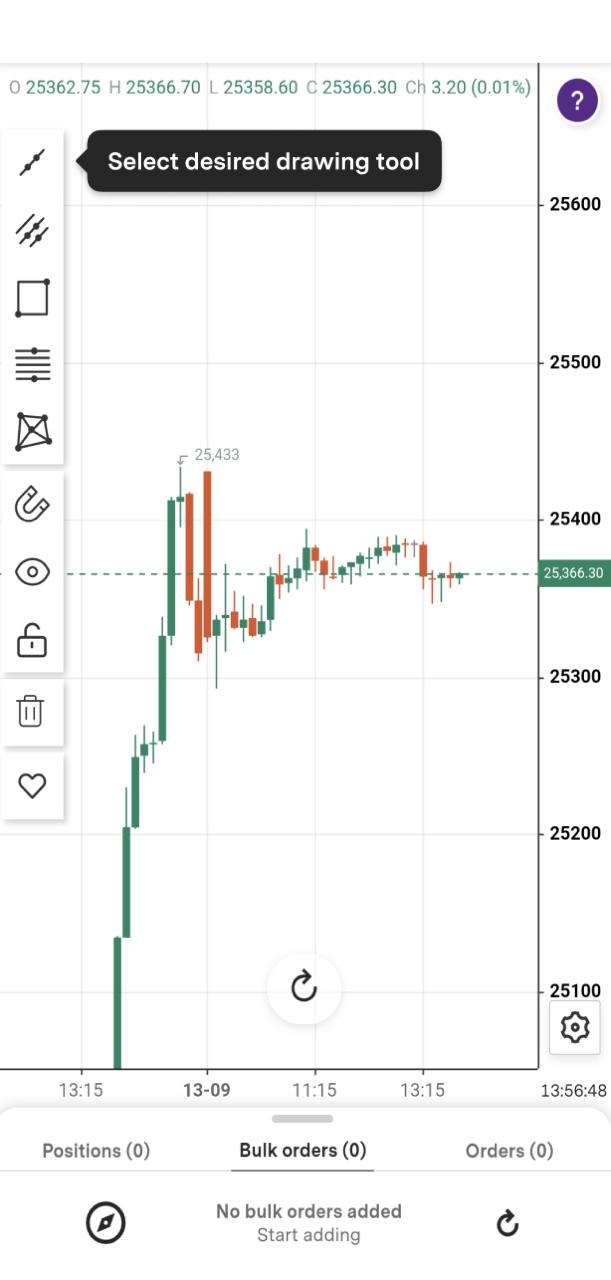
Step 6: Choose the drawing tool you want to use.
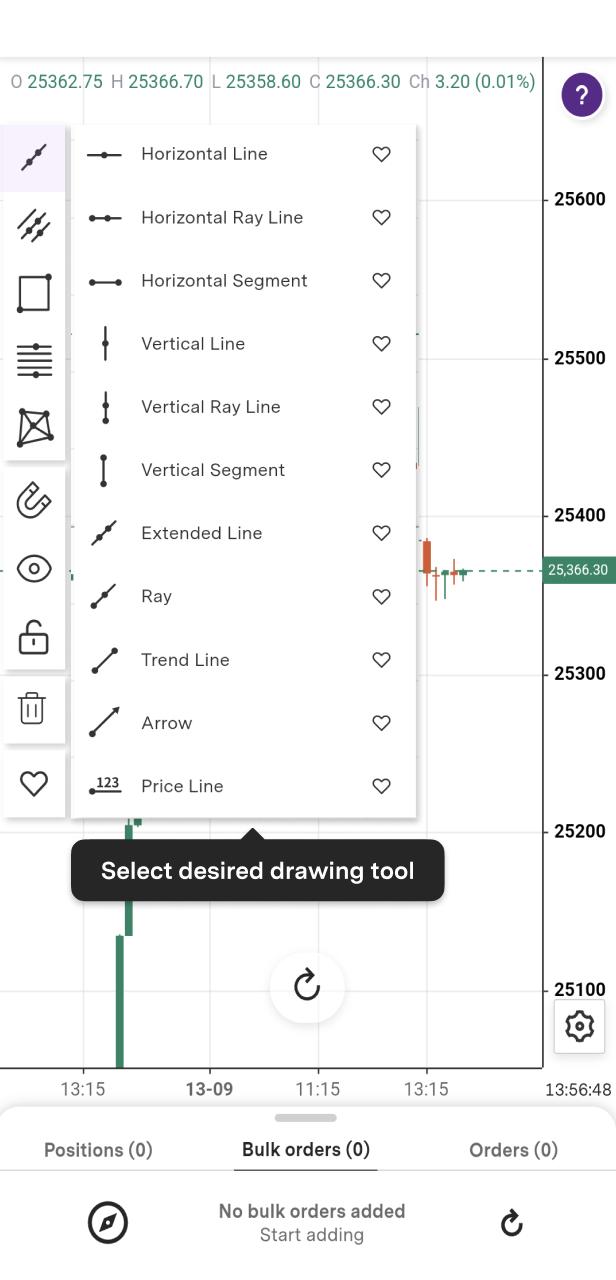
Step 7: Place your drawing on the chart.
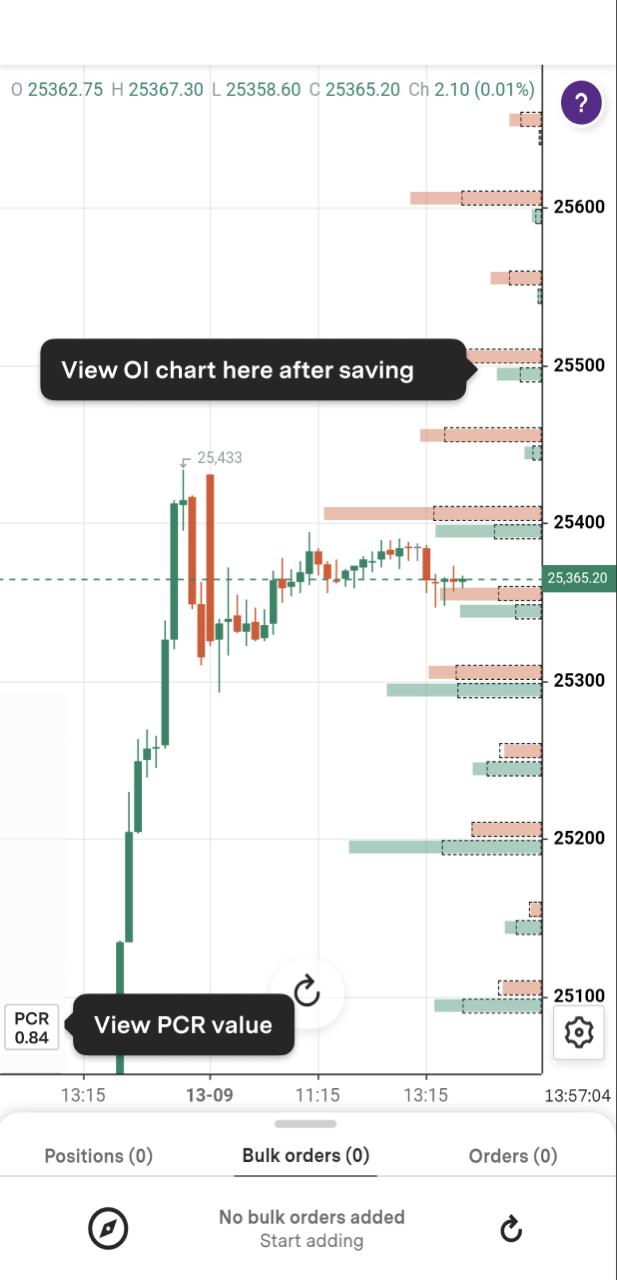
To add/view OI (Open Interest), follow the below steps:
Step 1: Click the Fx button to add an indicator.
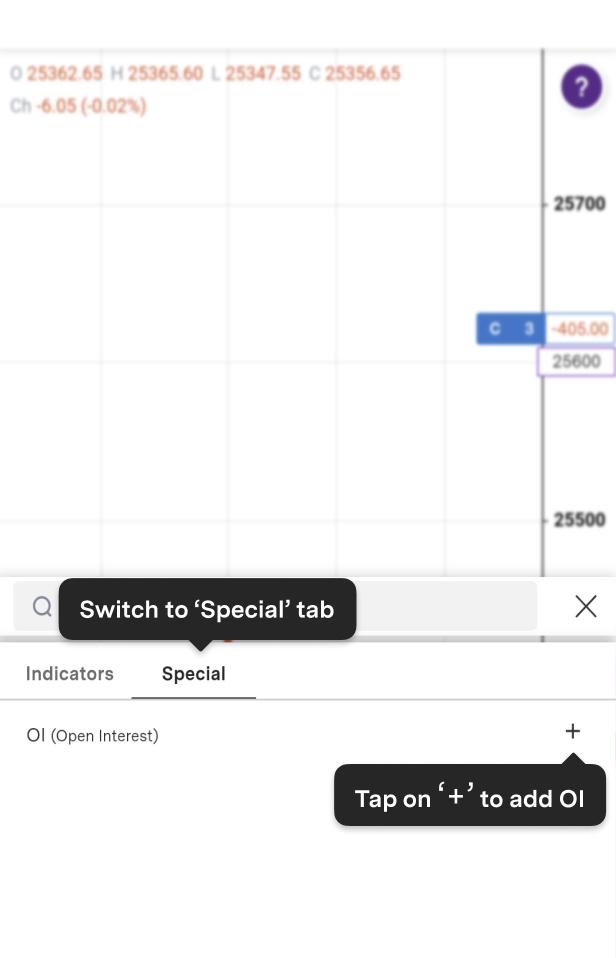
Step 2: Switch to the "Special" tab and tap the '+' icon to add OI (Open Interest).
Step 3: Click to Save settings.
Step 4: After saving, you can view your OI chart.
Trade with Upstox
Want to open a Demat account?
Open a FREE Demat and Trading account to invest in Stocks, Mutual Funds, IPOs and more.
By signing up you agree to receive transaction updates on Whatsapp. You may also receive a call from an Upstox representative to help you with the account opening process.
Upstox Community
Upstox Community
| Topic | Replies | Views | Activity |
|---|