Daily moving average: NIFTY50 stocks trading near daily moving average
Upstox
3 min read • Updated: March 31, 2024, 7:39 PM
Summary
Technical analysis is critical to any trader's journey in the stock market. Most start technical analysis using simple indicators like moving averages, supertrends, RSI, etc. Let us delve more into daily moving averages and their structure and what they indicate in the price movements of any particular scripts.

Daily moving averages (DMA) are simply the price averages of the underlying stock or an index for a predetermined period. DMA smooths out the volatile price movement to constantly updated average price, which helps traders and investors make better decisions in the stock market.
These averages tend to show the stock trend based on historical prices. The daily moving averages also provide a reference point for a trader on how the price has changed over 20 days, 50 days or 200 days.
The daily moving averages are further divided into two categories, as below
What is Simple Moving Average (SMA)?
A SMA is the simple mean or average of the prices taken for a predetermined period. It is calculated by adding the prices of a predetermined number of days and dividing by the total number of days decided. For example, 20 SMA of NIFTY 50 will be calculated by dividing the closing prices of the past 20 days by 20. The line derived from the daily simple moving averages will provide a reference point for traders to understand the trend in the market. SMAs are slightly slower in indicating the exact trend in the market as they give equal weight to all the numbers taken.
What is Exponential Moving Average (EMA)?
An EMA or exponential moving average is the most widely used daily moving average indicator as it is slightly different from the simple moving average as it calculates the averages by distributing weights to the prices taken. It allocates higher weights to recent prices and lower weights to older prices. This helps in knowing the exact price trend as it gives a more accurate trend based on the latest prices.
Here are the top six NIFTY50 stocks trading near their daily moving average
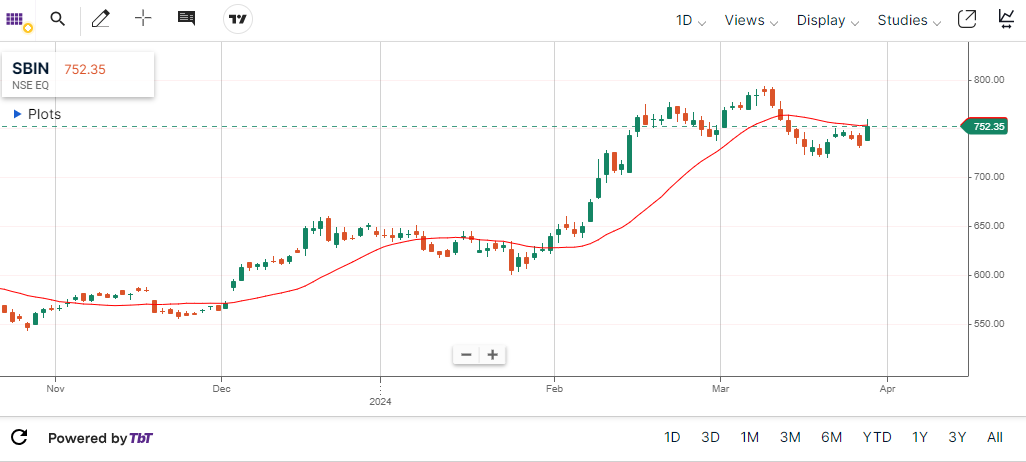
- SBI trades at 20 day moving average
Shares of State Bank of India are trading near its 20 day simple moving average price of ₹753 apiece on the NSE.
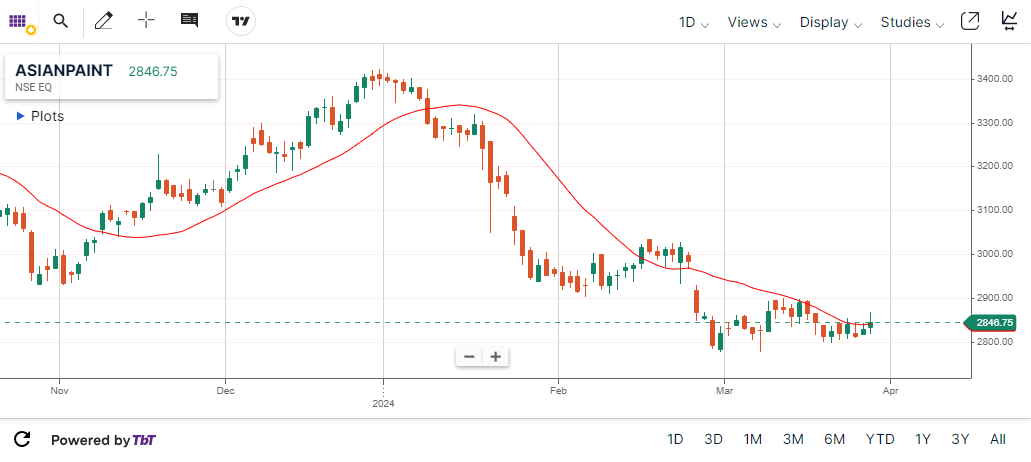
- Asian Paints trades near 20 day moving average
Shares of country's largest paints manufacturer are trading near 20 day SMA of ₹2,843 apiece on the NSE.
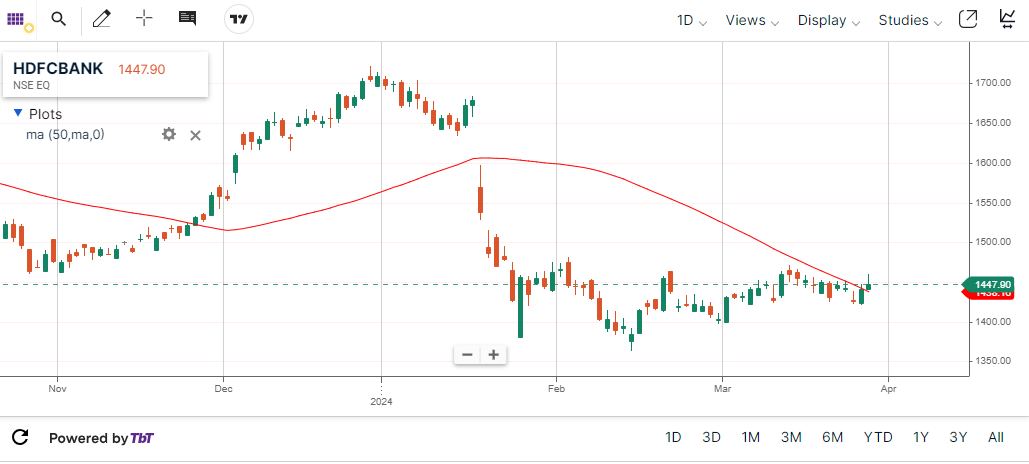
- HDFC Bank at 50-day moving average
shares of country's largest private sector lender HDFC Bank are trading near their 50 day SMA of ₹1,438 apiece on the NSE.
- ITC at 50-day moving average
Shares of cigarette to hotels conglomerate ITC ltd are trading near their 50 day SMA of ₹424 apiece on the NSE.

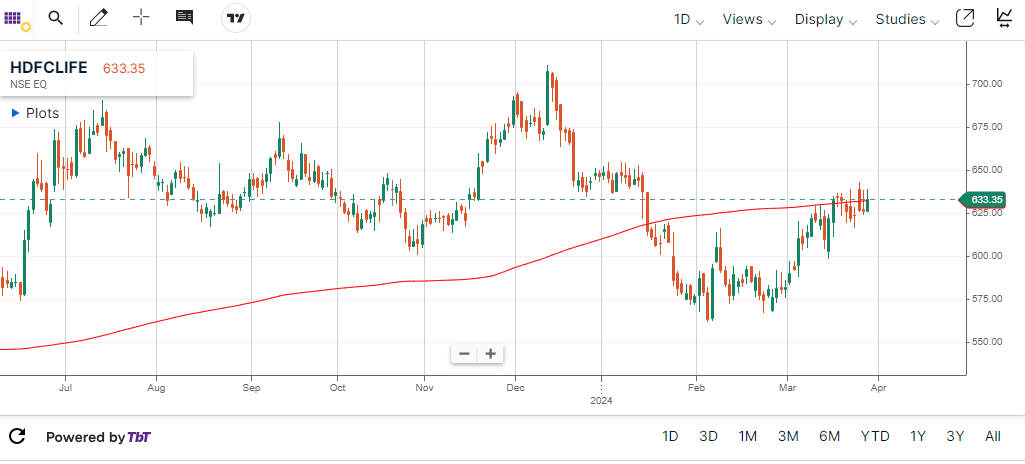
- HDFC Life trades at 200-day moving average
The shares of insurance arm of HDFC group, HDFC life is trading near its 200-day SMA of ₹ 632.
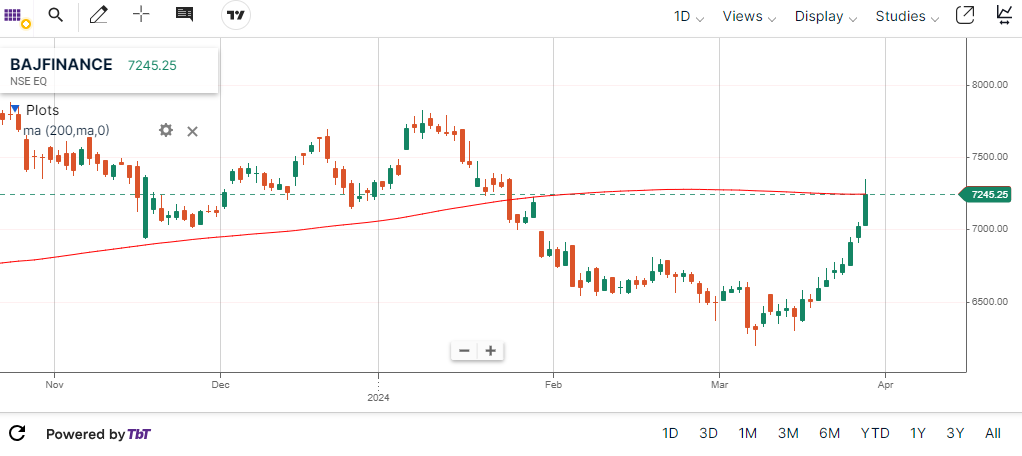
- Bajaj Finance trades near 200-day moving average
The shares of financial services major Bajaj Finance are trading near their 200 day SMA of ₹7,245 apiece on the NSE
Disclaimer: The stock names mentioned in this article are purely for educational purposes. We do not recommend any particular stock, securities and strategies for trading and investing in stock market.