Market News
Weekly market outlook: Monthly expiry, U.S. GDP data and other key factors to watch this week
.png)
6 min read | Updated on March 25, 2024, 16:38 IST


SUMMARY
For the holiday-shortened week, experts are suggesting a range-bound movement on light volumes. However, with the monthly expiry of F&O contracts, sharp swings due to intraday volatility can't be ruled out. Immediate support for the NIFTY50 remains at the 50- DMA (around 21,900) and the hurdle remains at the all-time high (22,526).
Monthly expiry, U.S. GDP data and other key factors to watch this week
Indian markets recovered from an initial dip and moved in sync with their global peers. Both the benchmark NIFTY50 and SENSEX made a quick recovery of nearly 2% from their respective lows to close higher. On a closing basis, the NIFTY50 gained 0.3% to end the week at 22,096 while the SENSEX gained 0.2% to end the day at 72,831.
Broader markets also broke their long losing streak and closed higher. The NIFTY Midcap 100 was up 1.3% and the Smallcap 100 gained 1.4%. However, both indices have corrected more than 5% and 9% from their recent highs.
Markets were jittery ahead of the U.S. Federal Reserve meeting, but rallied after the Fed maintained its outlook for three rate cuts by the end of 2024. In addition, Fed officials revised the GDP growth rate for 2024 to 2.1%, up from the 1.4% forecast in December, giving the bulls a boost. However, IT stocks came under selling pressure after Accenture cut its fiscal 2024 revenue forecast.
On the sectoral front, IT (-6.1%) and FMCG (-0.7%) were the top losers for the week. Real-Estate (+5.3%), Metals (+4.2%) and Automobiles (+4.2%) advanced the most.
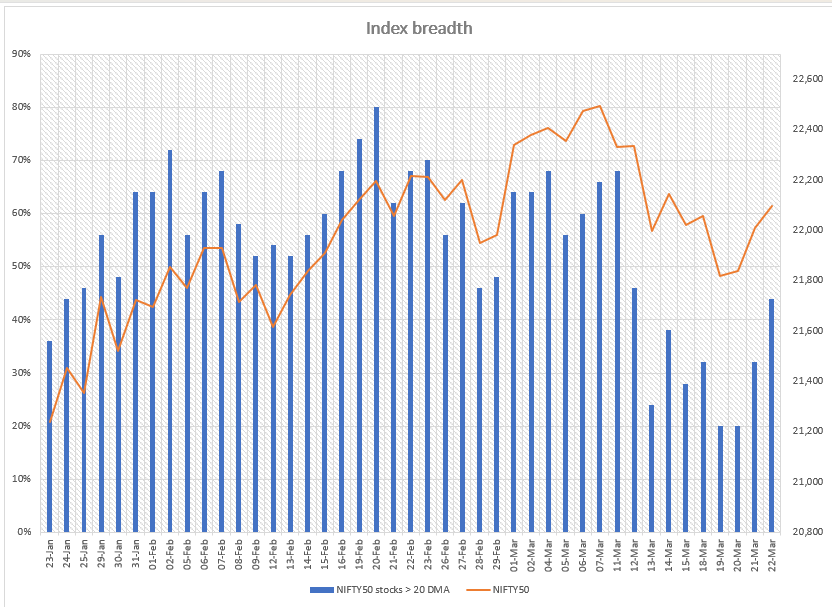
Index breadth- NIFTY50
Our breadth indicator suggests that the NIFTY50 is not out of the woods yet. As you can see in the chart below, after an initial bounce on 18 March, almost 80% of the NIFTY50 stocks fell below their respective 20-day moving averages (DMAs) during the week, indicating declining strength.
The chart below also shows that closer to the weekly expiry and after the U.S. Fed meeting, the index rebounded and we now have 44% of the NIFTY50 stocks trading above the 20 DMA. However, it is important to note that the breadth indicator tends to fluctuate between 50 and 70. Only a sustained rise above 50 could signal further upside momentum to or beyond 70.
FIIs positioning in the index
Foreign Institutional Investors (FIIs) started last week with a long-to-short ratio of 38:62 in index futures. However, as observed in our previous blogs, they gradually increased their open interest (OI) in the short contracts of the index futures. On the day of the weekly BANK NIFTY expiry, the short OI in the index futures rose from 62% to 69%, highlighting the overall weakness in the market.
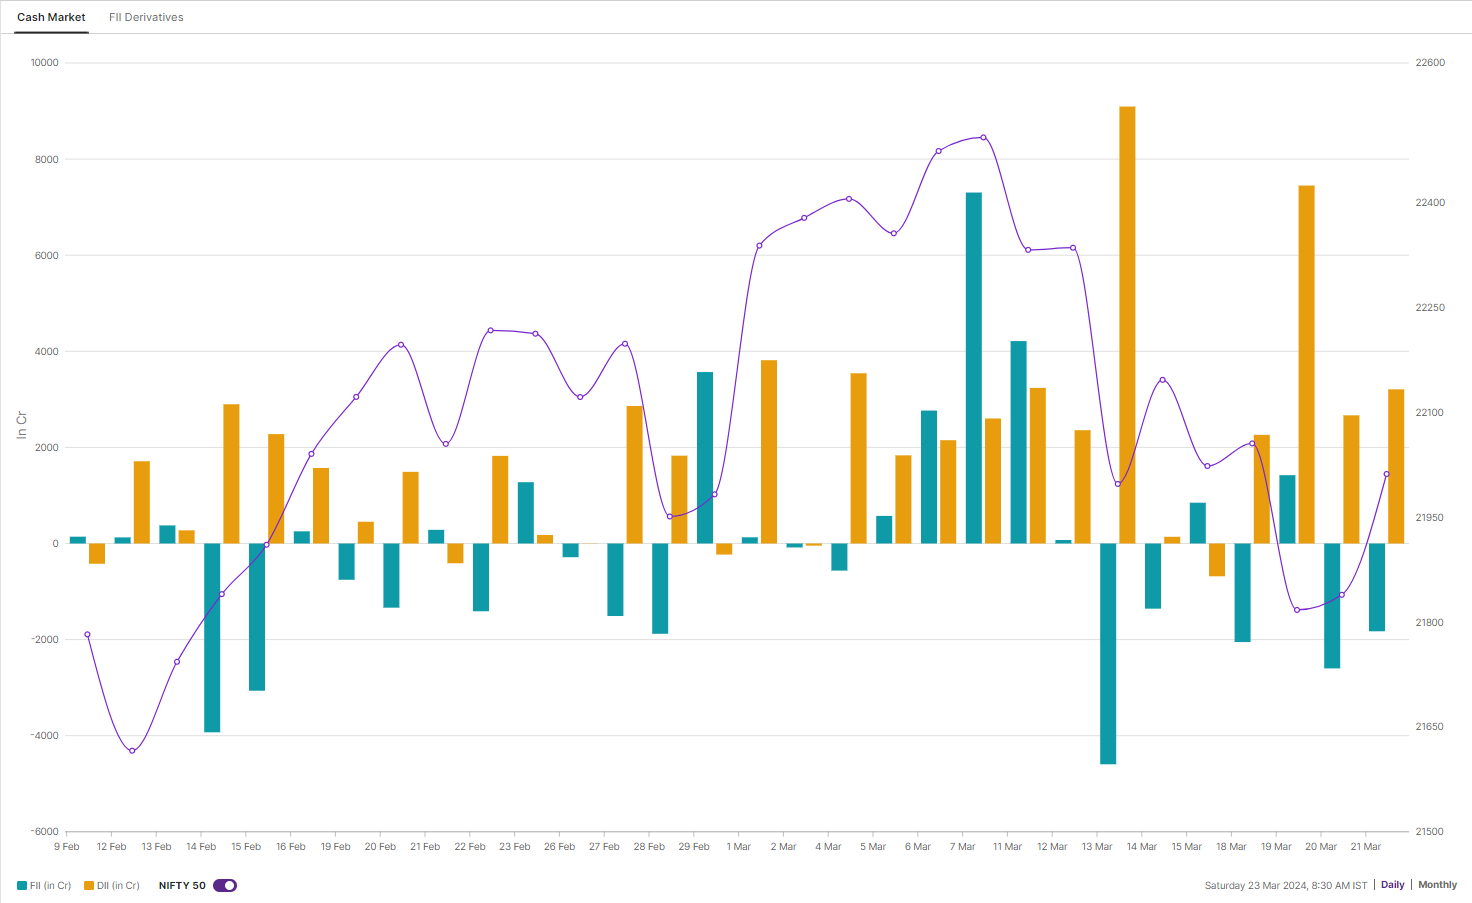
However, as seen in the chart below, the day after the FOMC meeting, they started to reduce their bearish bets. Currently, FIIs open interest (OI) in the index futures is 65% short and the net OI stands at -72,379 contracts. As mentioned earlier, we advise our readers to keep a close watch on any further trimming of net OI by FIIs and addition or reduction of bearish bets to get a clear understanding of the ongoing trend.

In the cash market, FIIs continued their selling spree and dumped shares worth ₹8,365 crore, while DIIs (Domestic Institutional Investors) again absorbed the selling pressure and bought shares worth ₹19,351 crore, taking the net institutional inflow for the week to ₹10,985 crore.
F&O - NIFTY50 outlook
Initial open interest in the NIFTY50 monthly expiry contracts shows a concentration of call options at the 22,500 and 22,000 strikes. Put options have a strong base at the 22,000 and 22,100 strikes. Based on the open interest, market participants expect the NIFTY50 to trade between 21,700 and 22,600 next week.

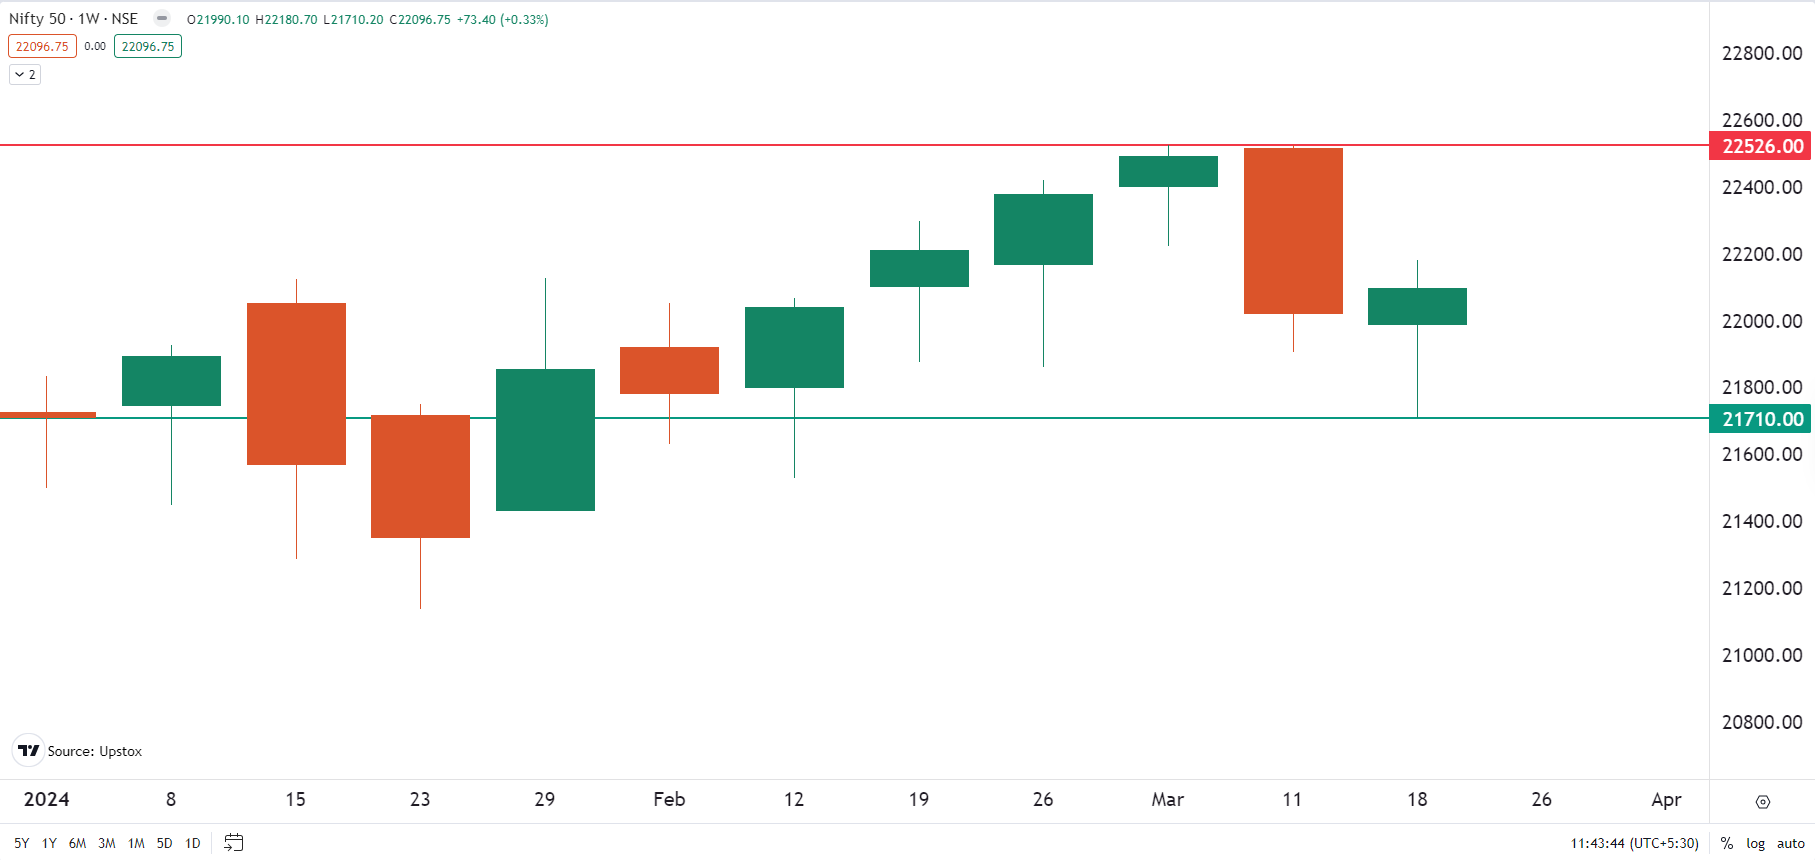
As mentioned in last week's analysis, the NIFTY formed a bearish engulfing candle on the weekly chart. This week's close below the previous week's would have confirmed the formation of a bearish engulfing candle. However, the NIFTY50 negated the bearish pattern.
In the holiday-shortened week, experts believe that the NIFTY50 index may consolidate between last week's low (21,710) and the recent all-time high (22,526). Given the concentration of OI at the 22,000 strike on both call and put options and the monthly expiry, traders are advised to remain cautious of sharp bouts of intraday volatility. The immediate hurdle for the bulls is 22,300, with support at 21,900.
F&O - BANK NIFTY outlook
For the 27 March expiry, significant call OI was seen on BANK NIFTY at the 47,000 and 48,000 strikes, while maximum put writing was seen at the 46,500 and 46,000 strikes. Based on options data, traders expect the BANK NIFTY to trade between 45,500 and 48,000 next week.

The BANK NIFTY has formed a hammer candlestick pattern on the weekly chart, which is considered a reversal pattern. The pattern will be confirmed if the next week's close is higher than the previous week's close (hammer candle).
Last week, the index continued to form doji candles on the daily chart, highlighting the indecisiveness of investors. However, on the 21 March, the BANK NIFTY regained its 50-DMA, protecting the 46,500 level. In the week ahead, immediate support for the BANK NIFTY lies between 46,300 and 46,500, while immediate resistance is at 47,200.
For the holiday-shortened week, experts are suggesting a range-bound movement on light volumes. However, with the monthly expiry of F&O contracts, sharp swings due to intraday volatility can't be ruled out. Immediate support for the NIFTY50 remains at the 50- DMA (around 21,900) and the hurdle remains at the all-time high (22,526).
And we'll keep you updated on the changes and important developments via our morning trade setup blog, which is available every day before the market opens at 8 am.

About The Author
Next Story