Market News
Volatility and trading around budget day

5 min read | Updated on February 12, 2026, 13:19 IST


SUMMARY
When the information is released, prices could continue to trend in the direction that they had been moving or there could be a sharp reversal.

To better understand how the markets react to the Union Budget including the day prior, day of, and day after, we can look at the historical daily returns.
Speculation in the markets occurs before the announcement of any new information. Even if you are relatively new to trading, you will likely be familiar with large price swings that can occur around announcements. These types of scheduled news releases can include consumer spending data, updated inflation numbers, corporate earnings announcements, or most relevant for the upcoming week – the Union budget. Because traders shouldn’t have inside information, they will make their best guess using past data, experience, and personal judgment to attempt to capture potential upside. However, they aren’t always correct. When the information is released, prices could continue to trend in the direction that they had been moving or there could be a sharp reversal. The prices may even stay relatively flat if the information that was released was generally expected by the market weeks or months ago.
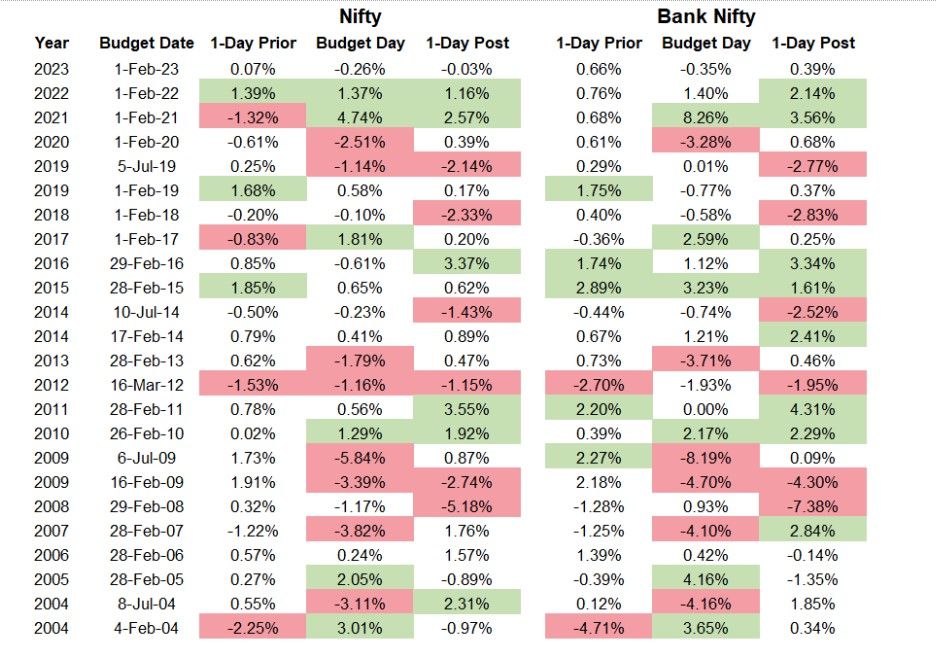
In the table below, we show the daily returns for both the Nifty and Bank Nifty on the days surrounding past budget days going back 20 years. We have also included interim budget days in this table. We have also highlighted some returns in green and red. If the return is highlighted in green, this means that the return is more than 1-standard deviation above the average returns for that year. What this means is that if the return is in green, this particular day was in the top ~32% of daily returns for that particular year. If the return is in red, then this value is less than 1-standard deviation below the average returns for that year. So, these values are in the bottom ~32% of daily returns for that particular year.
Implied volatility impact
For both the Nifty and Bank Nifty as shown in the table above, approximately half of the days surrounding the historical budget day have had a daily return one-standard deviation above or below the average daily return. So, based on the historical returns, the indices could be volatile around budget day. How does the option market react around this day?
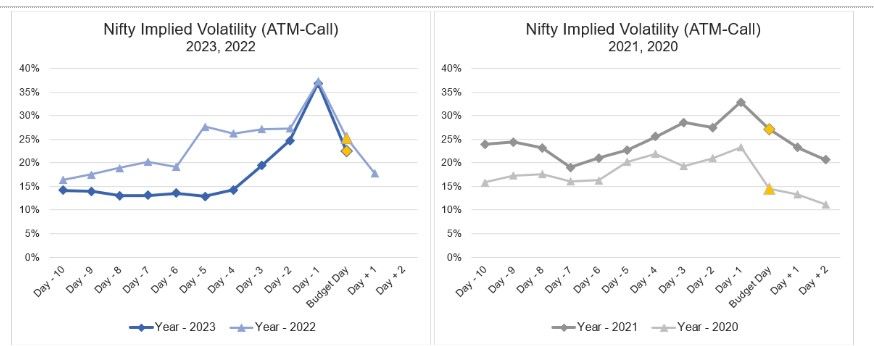
The below are the implied volatility plots for the at-the-money call options for the Nifty. The expiration for these options is the one closest to the budget day. We plotted the last four years but have split them into two charts to make it easier to read. On the left, you see the change in implied volatility prior to, on, and after the budget day for 2022 and 2023. You can clearly see an increasing spike in implied volatility which is driven by traders purchasing options prior to the budget day. On budget day, which is highlighted as the ‘yellow’ data point, you can see a sharp reduction in implied volatility as traders exit and sell their trades. A similar pattern exists in 2020 and 2021 which is displayed on the right chart. While the increase in volatility is more gradual, and not as high, as the more recent years, there is still a pronounced decline in implied volatility post-budget day.
Trading straddles
As traders, how can we take advantage of this information? The Nifty is currently trading at 21238.80 and the next expiry falls on the Budget Day. The price of the straddle with 21250-strike price is 478.00. In order to breakeven, the Nifty would need to move up or down approximately 2.2%. Because of this, you can interpret that the market is implying the Nifty will move up or down 2.2% between now and expiry – which includes the budget day. The reason you can imply this +/- 2.2% move from the market prices of a straddle is because if traders believed that the Nifty would move more, they would buy straddles thus driving up the price and the breakeven move. Alternatively, if traders believed that the Nifty would move less, they would sell straddles which would lower the price.
Derivatives trading must be done only by traders who fully understand the risks associated with them and strictly apply risk mechanisms like stop-losses. The information is only for consumption by the client and such material should not be redistributed. We do not recommend any particular stock, securities and strategies for trading. The stock names mentioned in this article are purely for showing how to do analysis. Take your own decision before investing._
About The Author
Next Story
