Market News
Trade setup for 26 July: BANK NIFTY tests 50-DMA, bearish signals on the weekly chart?
.png)
4 min read | Updated on July 26, 2024, 08:26 IST


SUMMARY
The BANK NIFTY is forming a bearish candle on the weekly chart, engulfing the lows of previous four candles. The index closed below the high of the election day result, indicating further weakness. Traders should monitor the weekly close of the index, a close below the low of election day will signal additional bearish momentum.
Stock list

After opening almost 1% lower, the NIFTY50 recovered all its opening losses to close flat on 25 July, the monthly expiry of the index's futures and options contracts.
Asian markets update at 7 am
The GIFT NIFTY is up 0.3%, pointing to a positive start for the Indian equities today. Meanwhile, the other Asian counterparts are also trading in the positive territory. Japan’s Nikkei 225 is up 0.8%, while Hong Kong’s Hang Seng index rose 0.2%.
U.S. market update
- Dow Jones:39,935 (▲0.2%)
- S&P 500: 5,399 (▼0.5%)
- Nasdaq Composite: 17,181 (▼0.9%)
U.S. indices attempted an unsuccessful rebound on Thursday as both the S&P 500 and the Nasdaq remained volatile due to the sell-off in technology stocks. Investors also shrugged off second-quarter GDP data, which came in at 2.8%, beating estimates of 2.1%.
Wall Street will focus on Friday's inflation data. The Federal Reserve's preferred measure of inflation is personal consumption expenditures or PCE. Street estimates and forecasts are for PCE to have slowed to 2.4% YoYin June from 2.6% in May.
NIFTY50
- August Futures: 24,455 (▼0.3%)
- Open Interest: 5,20,874 (▲54.9%)
After opening almost 1% lower, the NIFTY50 recovered all its opening losses to close flat on 25 July, the monthly expiry of the index's futures and options contracts. Despite weak cues from global markets, the index recovered nearly 200 points from the day's low, reflecting the strength of the index.
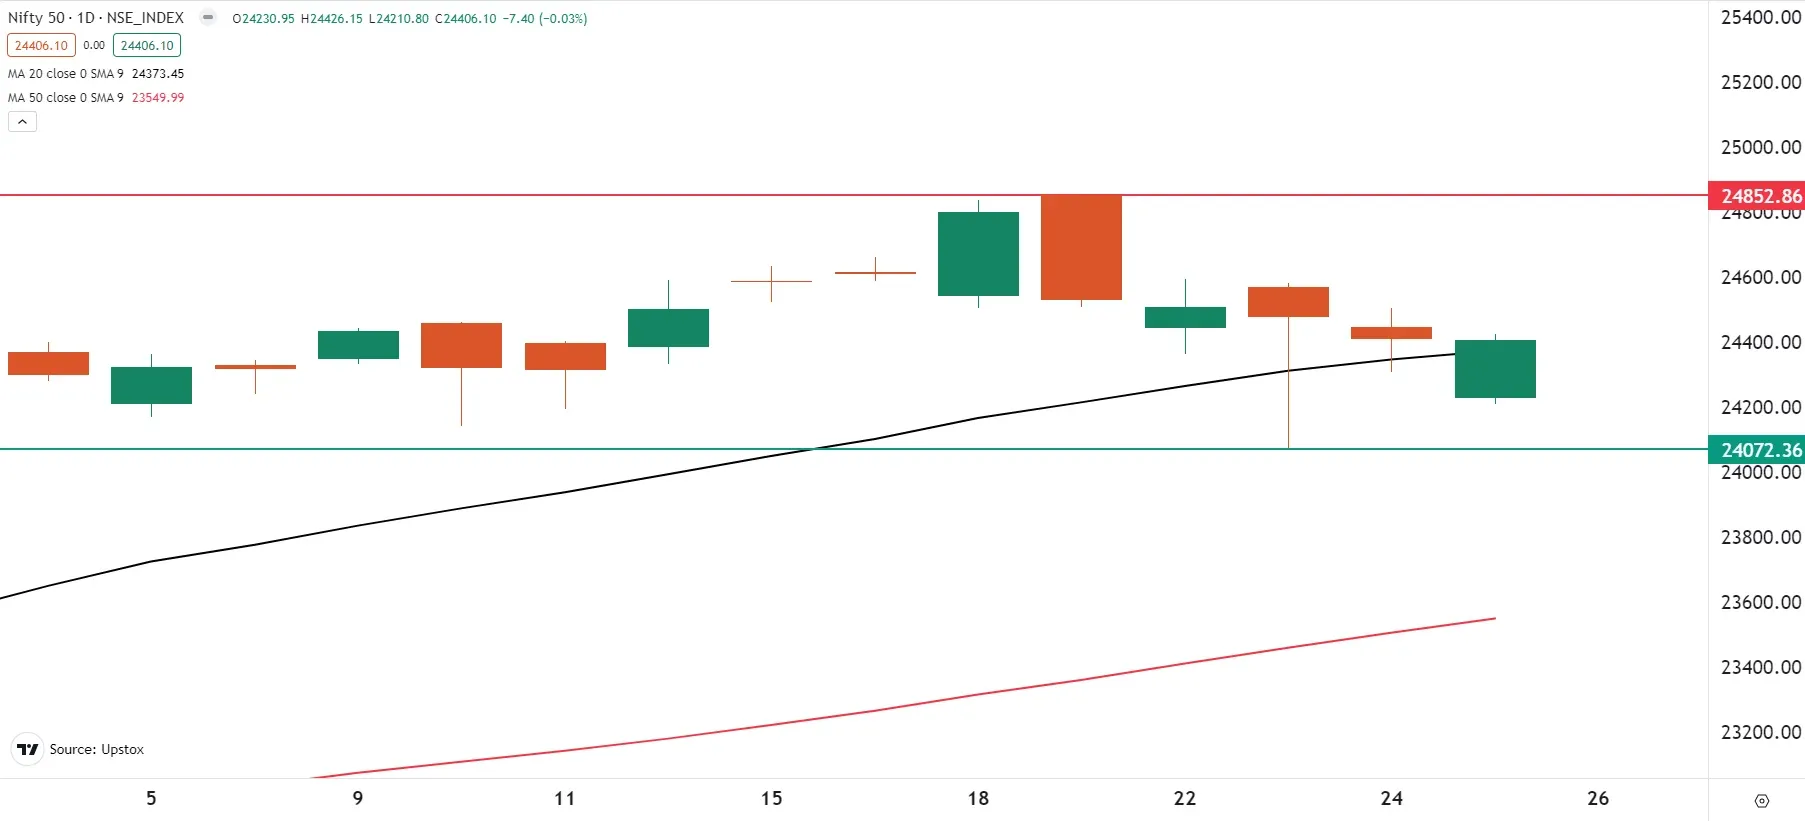
On the daily chart, the NIFTY50 protected its 20-day moving average for the third day in a row, as well as the 24,200 support level on a closing basis. The index is currently trading between its all-time high (24,854) and daily low (24,074). Until the index breaches this range on a closing basis, traders may consider non-directional strategies.
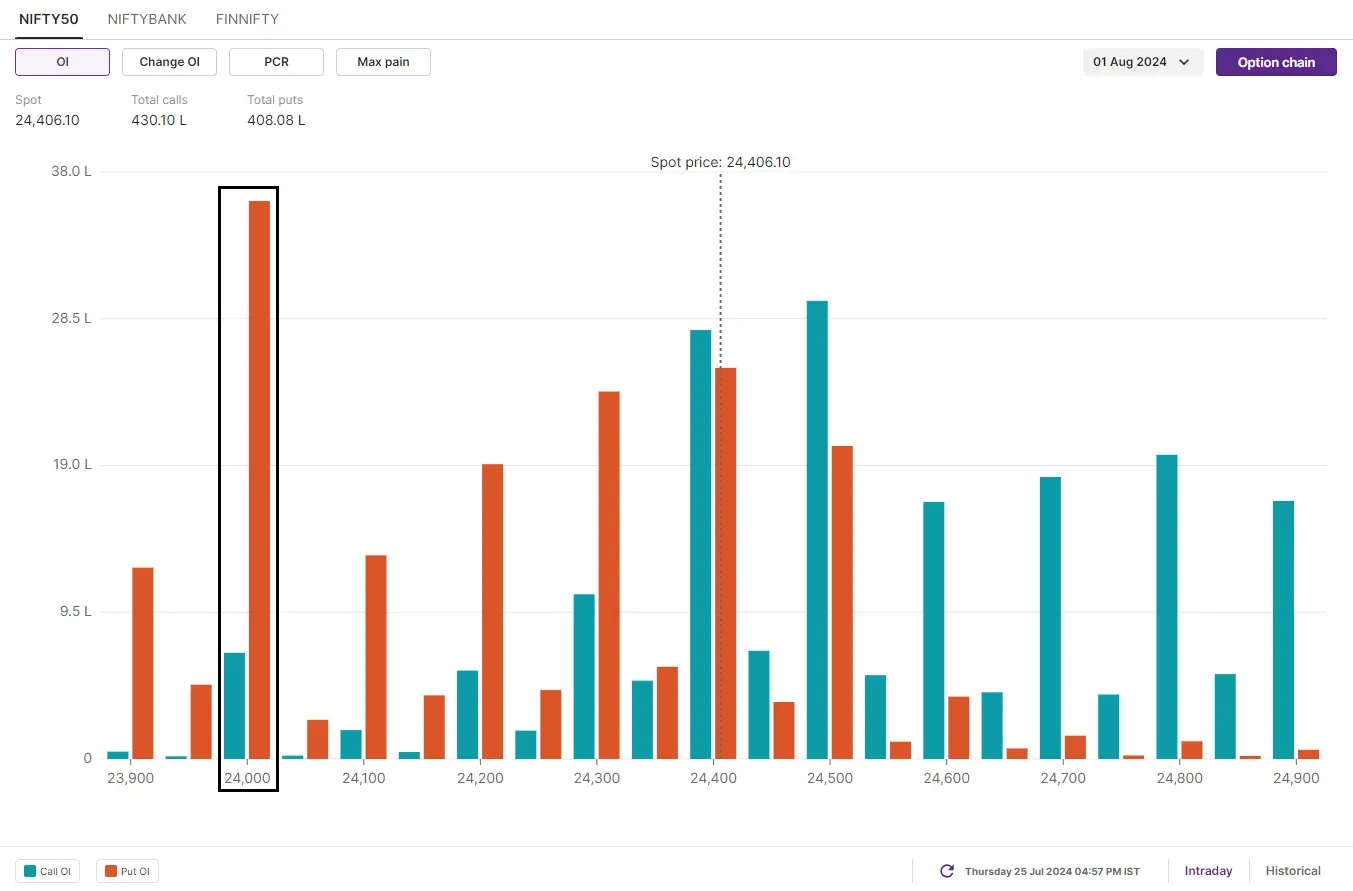
The initial open interest accumulation for the August 1 expiry has a maximum call accumulation at the 25,000 strike, making it a resistance zone. On the flip side, the put base is accumulating at the 24,000 strike, indicating support. In addition, there is a significant call and put base at the 24,400 strike, suggesting a range-bound movement around these levels.
BANK NIFTY
- August Futures: 51,165 (▼0.8%)
- Open Interest: 1,23,149 (▲63.3%)
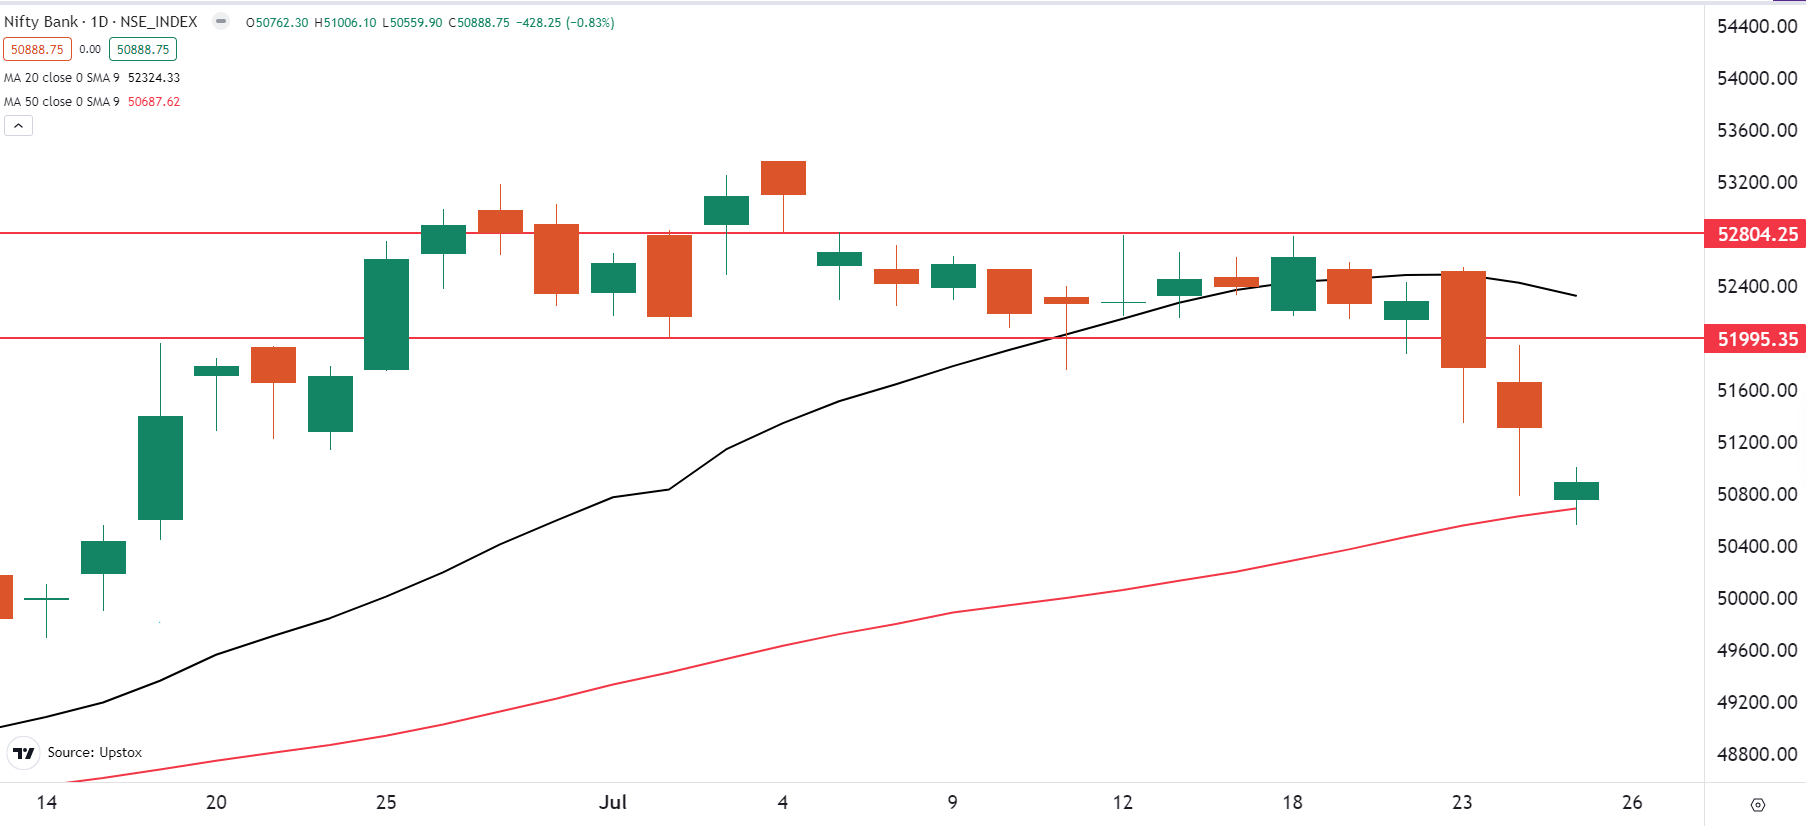
The BANK NIFTY continued its losing streak for the third consecutive day, testing the 50-day moving average. The index slipped below the crucial support zone of 51,000 and closed below this level.
As highlighted in our yesterday’s blog, the technical structure of the index remains weak, trading between the 20-day and 50-day moving averages (DMAs). In the upcoming sessions, the key level of 52,000, now a resistance, will be crucial to monitor.
While the index remains stuck between the 20 and 50-DMA, traders may experience volatility and should consider range-bound strategies. However, directional strategies can be planned once the index either reclaims 20-DMA or closes below 50-DMA.
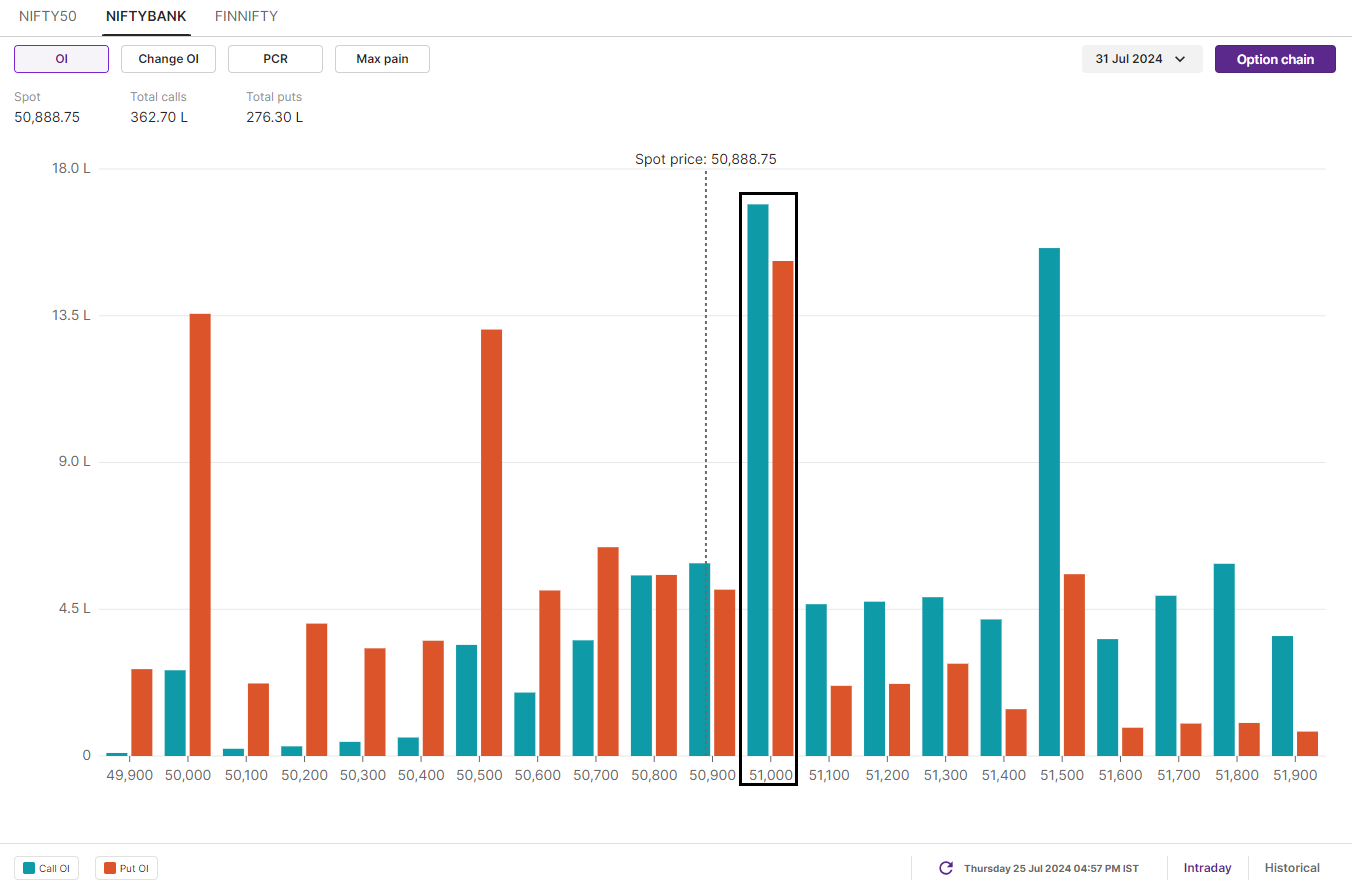
Open interest in the BANK NIFTY monthly expiry has the highest call bases at 53,000 and 52,000 strikes. On the other hand, the put base is spread from 50,000 to 50,500 strikes. The index has also seen significant call and put accumulation at the 51,000 strike, suggesting consolidation around this level.
FII-DII activity
Stock scanner
In Futures and Options or F&O, long build-up means an increase in Open Interest (OI) along with an increase in price, and short build-up means an increase in Open Interest(OI) along with a decrease in price.
Source: Upstox and NSE.
Disclaimer: Derivatives trading must be done only by traders who fully understand the risks associated with them and strictly apply risk mechanisms like stop-losses. The information is only for consumption by the client and such material should not be redistributed. We do not recommend any particular stock, securities and strategies for trading. The securities quoted are exemplary and are not recommendatory. The stock names mentioned in this article are purely for showing how to do analysis. Take your own decision before investing.
About The Author
Next Story


