Market News
Trade setup for 12 July: NIFTY50 extends consolidation, close above 24,400 reaffirms bullish trend
.png)
5 min read | Updated on July 12, 2024, 10:43 IST


SUMMARY
Traders should keep a close eye on the weekly close of the NIFTY50 and the BANK NIFTY, which are currently giving mixed signals. The NIFTY50 is showing early signs of a doji candle, indicating indecision. However, a close above 24,400 would signal a continuation of the bullish trend.
Stock list
Currently, the NIFTY50 index is showing early signs of forming a doji candlestick pattern on the weekly chart
Asian markets update at 7 am
The GIFT NIFTY is up 0.2%, indicating a positive start for Indian equities today. Meanwhile, Asian markets are trading mixed. Japan's Nikkei is down nearly 2%, while Hong Kong's Hang Seng Index is up 1.7%.
U.S. market update
Dow Jones: 39,753 (▲0.0%) S&P 500: 5,584 (▼0.8%) Nasdaq Composite: 18,283 (▼1.9%)
U.S. indices ended the day in the red, led by sharp falls in heavyweight technology stocks. Shares of Tesla, Nvidia, Alphabet (Google), Amazon, Meta Platforms and Apple were all down between 8% and 2%.
The catalyst for the move was the Consumer Price Index reading, which showed that inflation is cooling faster than expected. The CPI fell slightly from May, the first month-on-month decline since May 2020. On a year-on-year basis, it was up 3%, below expectations of 3.1%.
As it became a sell-the-news moment on Wall Street, the odds of a September rate cut rose to 93%, according to the CME FedWatch tool.
NIFTY50
July Futures: 24,382 (▲1.0%) Open Interest: 5,45,366 (▼3.0%)
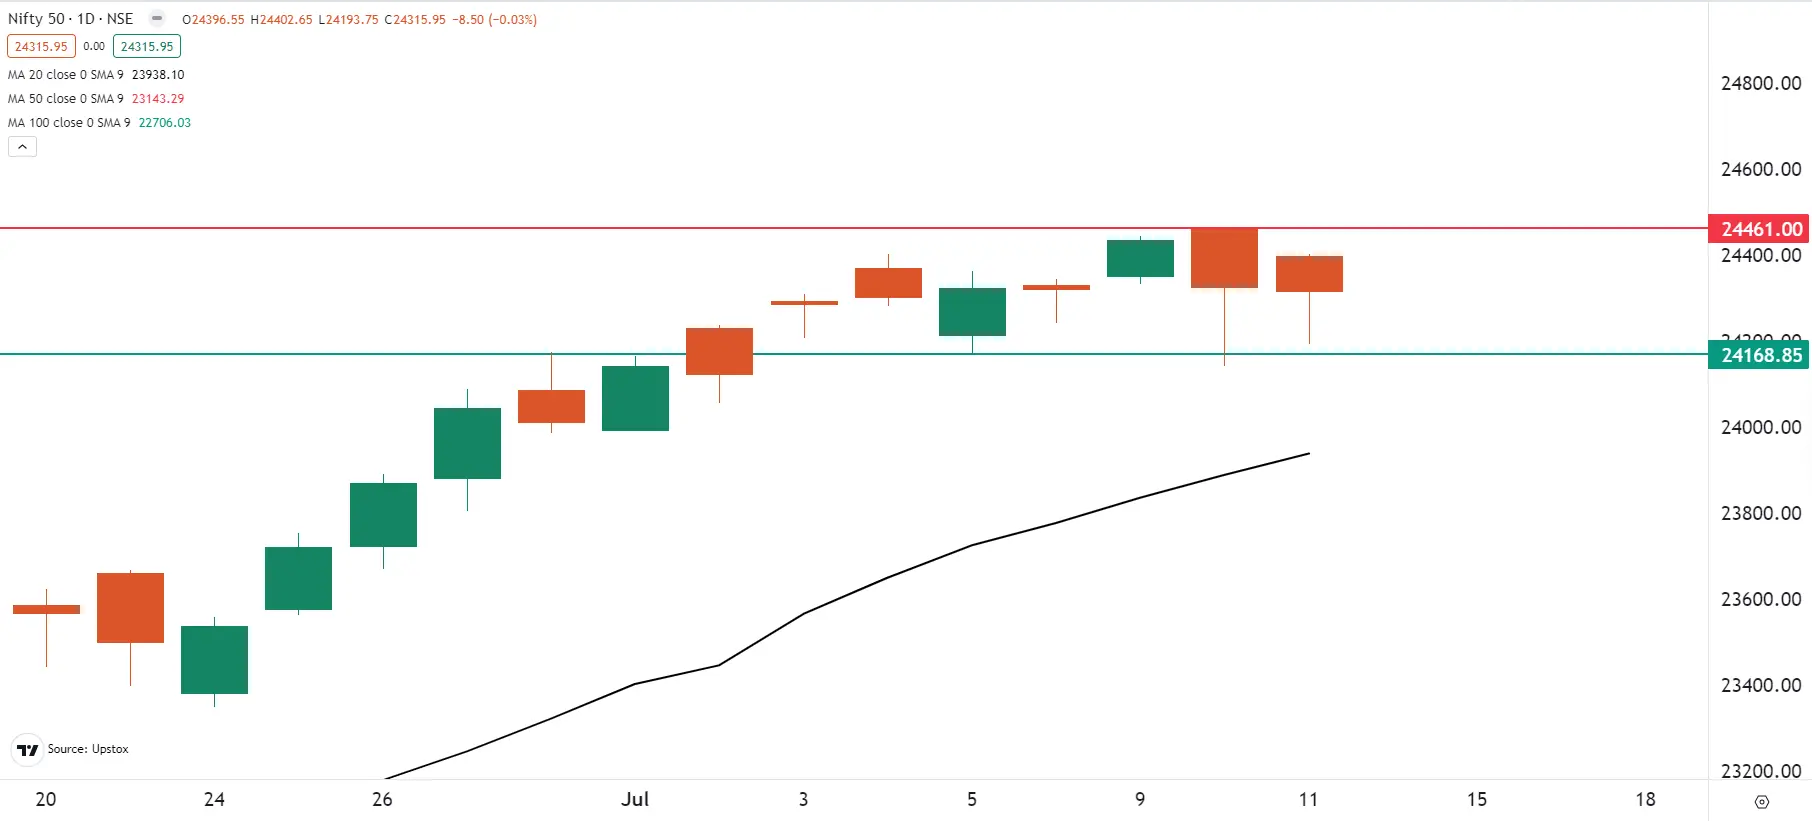
The NIFTY50 index traded in a narrow range on the weekly expiry of its options contracts, closing the day flat around the 24,300 level. The index experienced sharp intraday volatility, forming an inside candle on the daily chart.
The index formed a bearish engulfing candlestick pattern on the 10 July, but saw strong buying during the decline towards the 24,100-24,200 zone. The index confirmed the bearish reversal pattern on the 10 July, as it closed lower than the bearish pattern. However, it again saw strong buying from the 24,100-24,200 area and formed a large shadow. This indicates a strong presence of buyers at lower levels.
Currently, the NIFTY50 index is showing early signs of forming a doji candlestick pattern on the weekly chart, highlighting investor indecision. The index has been trading within a range of 24,450 and 24,100 and until it breaks out of this range, the price action may remain range-bound. For further clues, traders can monitor today's price action along with the weekly close and plan their strategies accordingly.
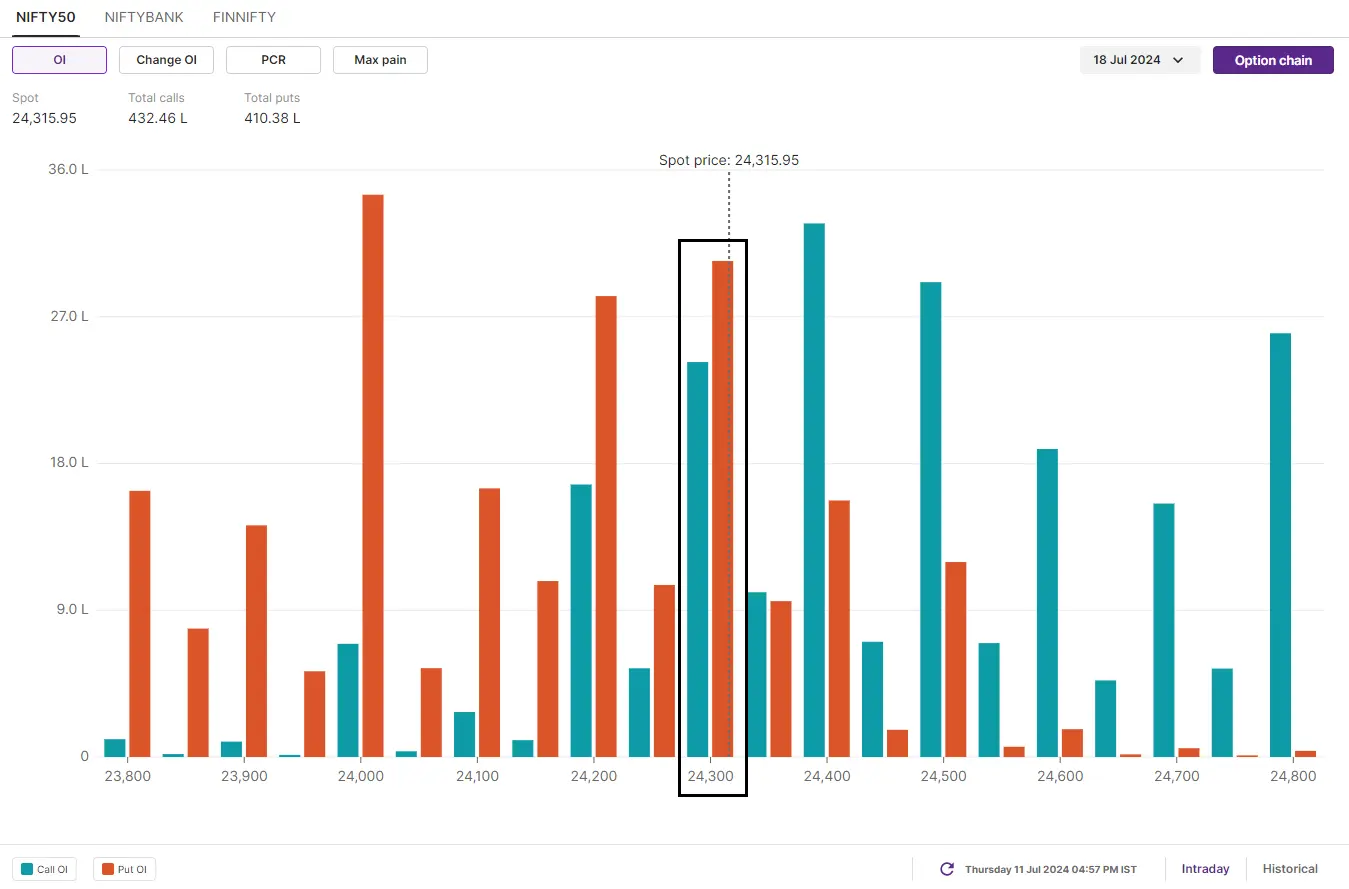
The initial open interest build-up for the 18 July expiry has the highest call base at the 24,400 and 24,500 strikes. These strikes could act as resistance for the index in the coming sessions. On the other hand, the highest put base is accumulated at the 24,000 strike, indicating immediate support for the index. Similar to last week, the index again has significant open interest in both call and put options at the 24,300 strike, suggesting a range-bound activity.
BANK NIFTY
July Futures: 52,439 (▲0.2%) Open Interest: 1,45,215 (▼7.1%)
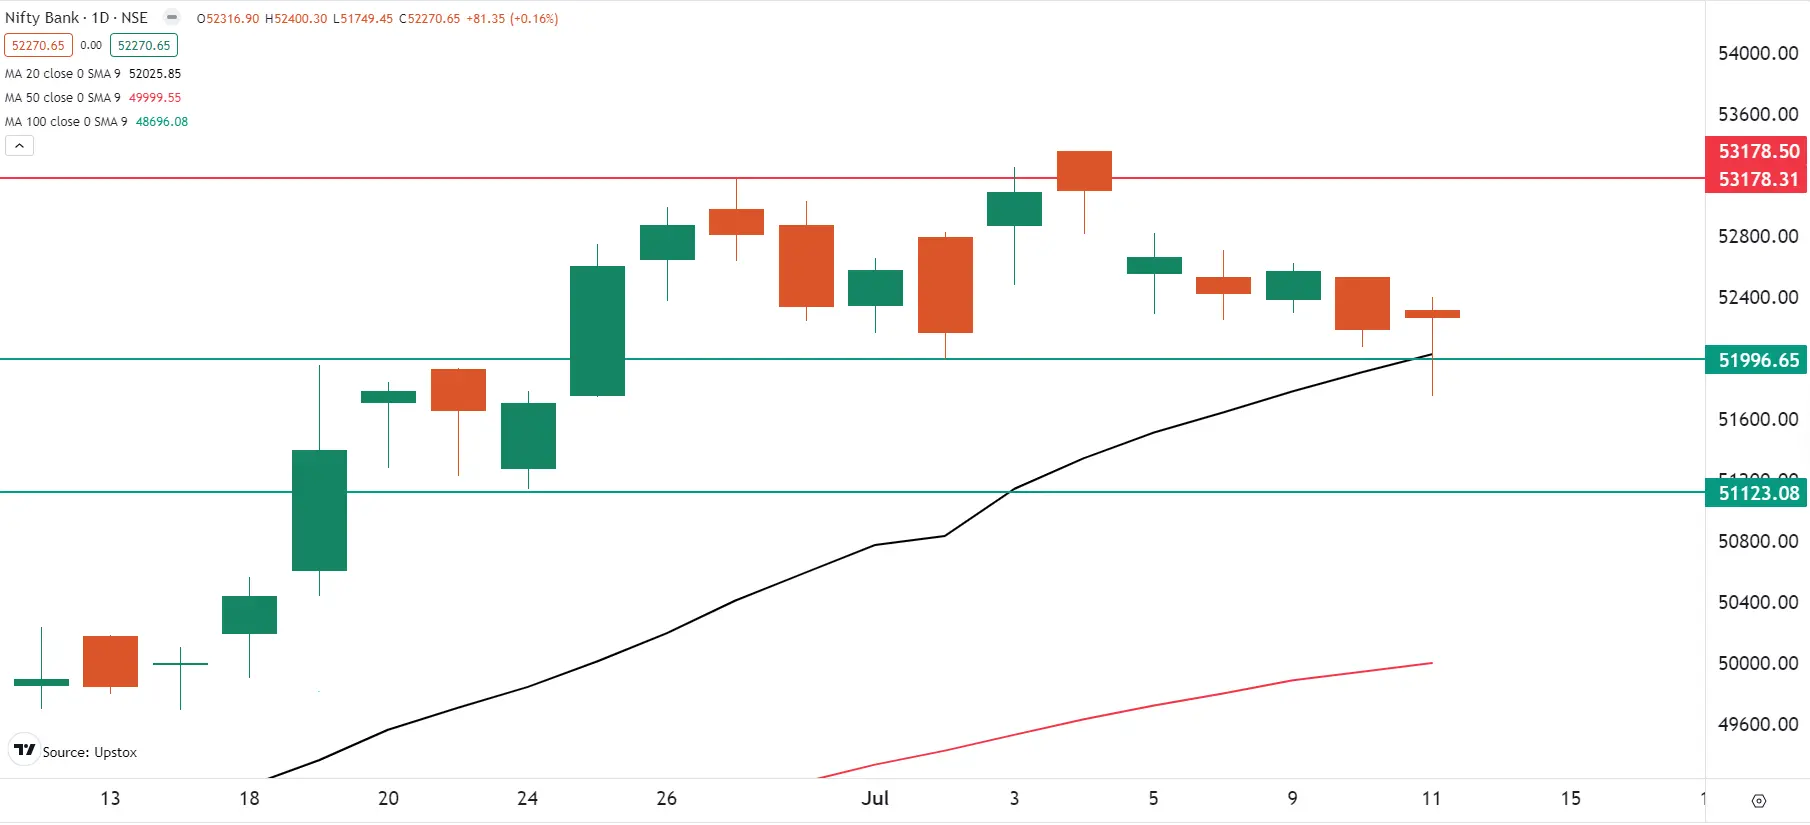
In the first half of the session, the BANK NIFTY fell below the key 52,000 level, hitting important support zones. However, a short-covering rally in the second half helped the index recoup all its losses and closed above the 52,000 level..
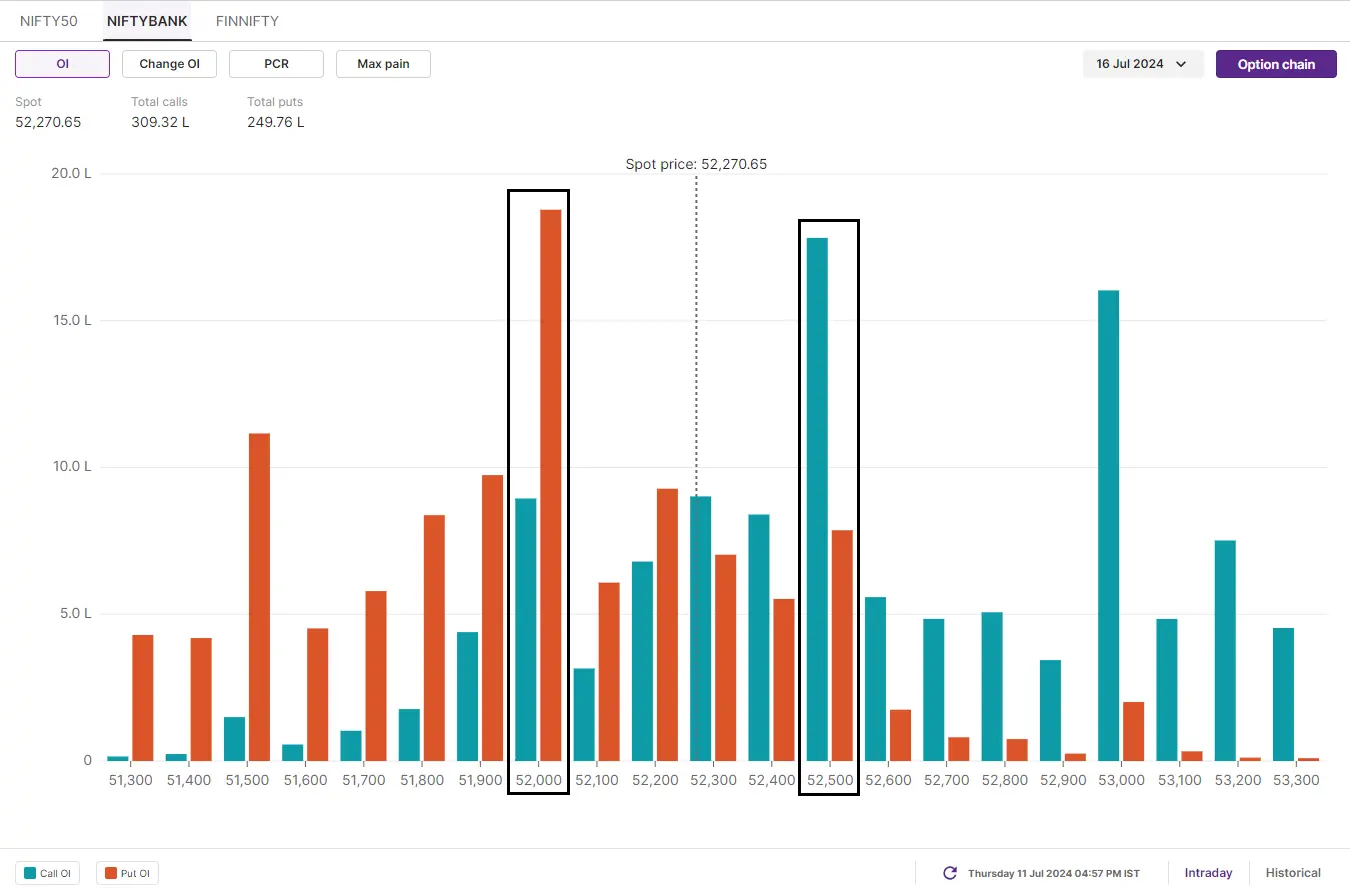
On the daily chart, the BANK NIFTY has formed a doji candlestick pattern with a long lower shadow, indicating support at lower levels. The index is protecting its 20-day moving average and saw significant put writing in the second half of the session at the 52,000 level. In the coming sessions, the index has immediate resistance at 52,500, a break of which will open the doors for 53,000.
The open interest data for the 16 July expiry has maximum call base at 52,500 and 53,000 strikes, making these as crucial resistance zones for the index. On the contrary, the put base was seen at 52,000 and 51,500 strikes, making it as crucial support zones.
FII-DII activity
Stock scanner
-
Under F&O ban: Aditya Birla Fashion and Retail, Balrampur Chini Mills, Bandhan Bank, Chambal Fertilisers, Gujarat Narmada Valley Fertilisers & Chemicals, RBL Bank, Indian Energy Exchange, India Cements, Indus Towers and Piramal Enterprises
Out of F&O Ban: N/A
In Futures and Options or F&O, long build-up means an increase in Open Interest (OI) along with an increase in price, and short build-up means an increase in Open Interest(OI) along with a decrease in price.
Source: Upstox and NSE.
Disclaimer: Derivatives trading must be done only by traders who fully understand the risks associated with them and strictly apply risk mechanisms like stop-losses. The information is only for consumption by the client and such material should not be redistributed. We do not recommend any particular stock, securities and strategies for trading. The securities quoted are exemplary and are not recommendatory. The stock names mentioned in this article are purely for showing how to do analysis. Take your own decision before investing.
About The Author
Next Story


