Market News
Trade setup for 26 March: NIFTY50 reclaims 50-DMA, Volatility index slips below 13
.png)
4 min read | Updated on March 26, 2024, 09:17 IST


SUMMARY
For the holiday-shortened week, traders expect the NIFTY50 to trade between 21,700 and 22,500. However, due to the monthly expiry, experts warn of the potential volatility and sharp intraday swings.

NIFTY50 reclaims 50 DMA, Volatility index slips below 13
Asian markets update 7 am
The GIFT NIFTY is up 0.2%, suggesting a positive open for the Indian equities. Asian markets are mixed, with Japan’s Nikkei 225 flat and Hong Kong’s Hang Seng index up 1%.
U.S. market update
U.S. stocks took a breather on Monday to start the holiday-shortened week lower. The Dow Jones Industrial Average slipped 0.4% and ended the day at 39,313, while the S&P 500 dropped 0.3% to 5218. The Nasdaq Composite fell 0.2% to 16,384.
NIFTY50
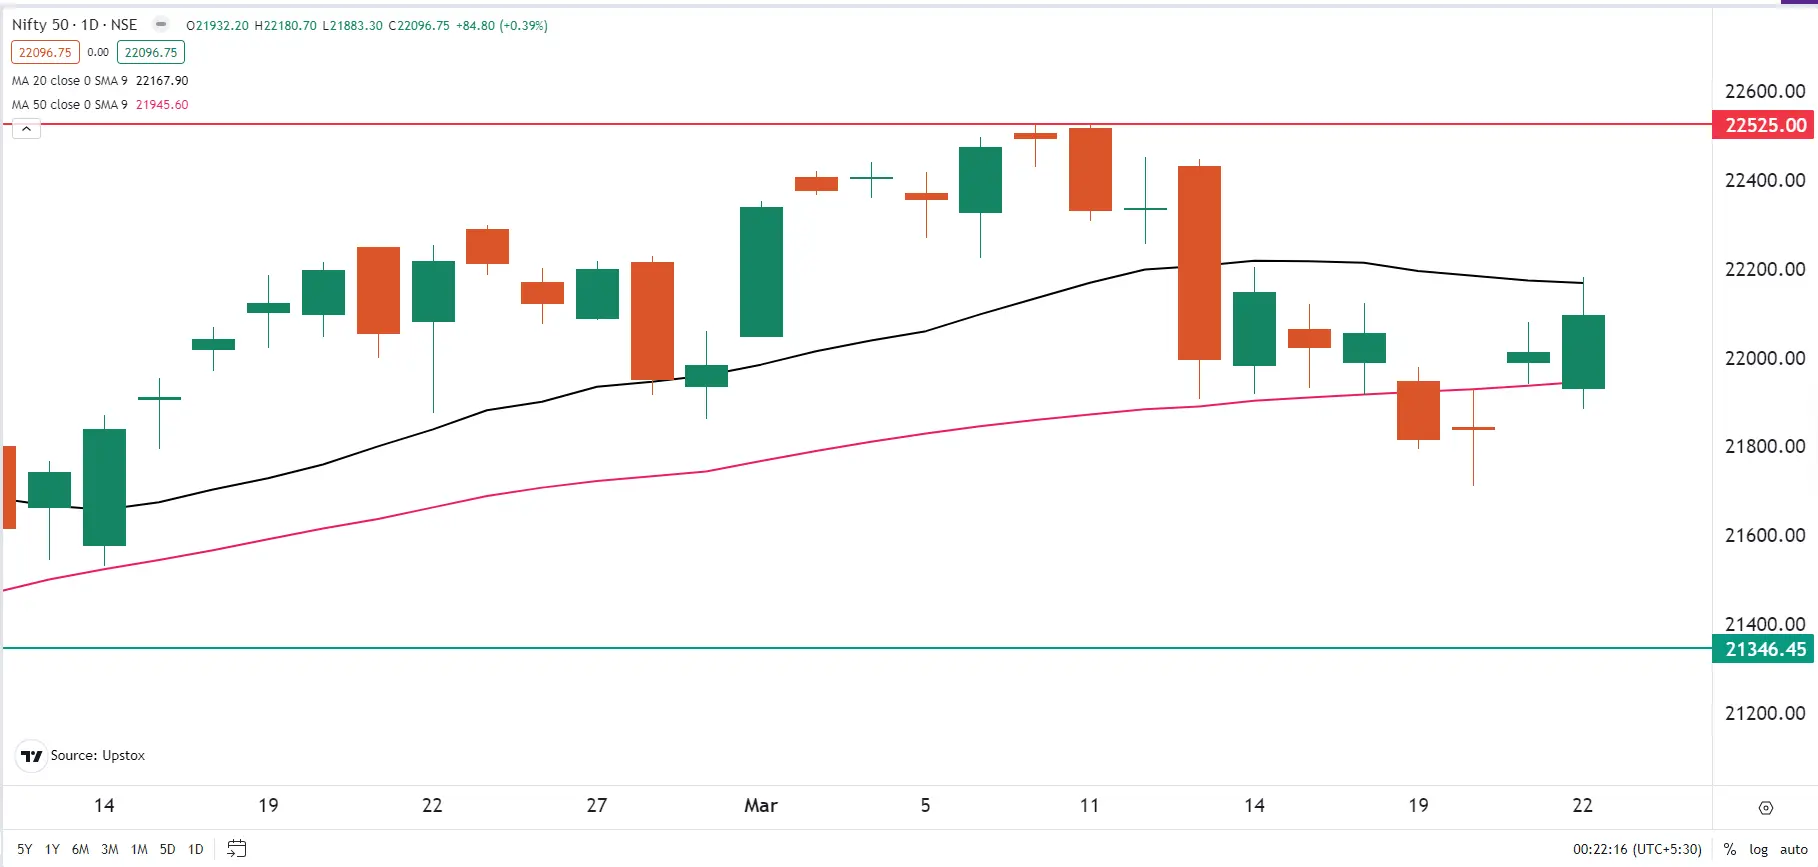
The NIFTY50 extended the gains for third consecutive day and formed a bullish engulfing candle on the daily chart, led by gains in metal and automobile stocks. Despite a lower opening, the index rebounded from the day’s low and closed above Thursday’s high, indicating support based buying.
After a period of indecision (doji on the 20th March), the NIFTY50 closed decisively above its previous high and regained its crucial 50-day moving average (DMA). This bullish engulfing candlestick pattern on the daily chart on Friday aligns in momentum with the bulls.
However, experts see the 22,300 and 21,700 levels as key resistance and support zones, especially with the monthly expiry coming up in a holiday-shortened trading week. A break above or below this zone on a closing basis is likely to provide a clearer direction for the market.
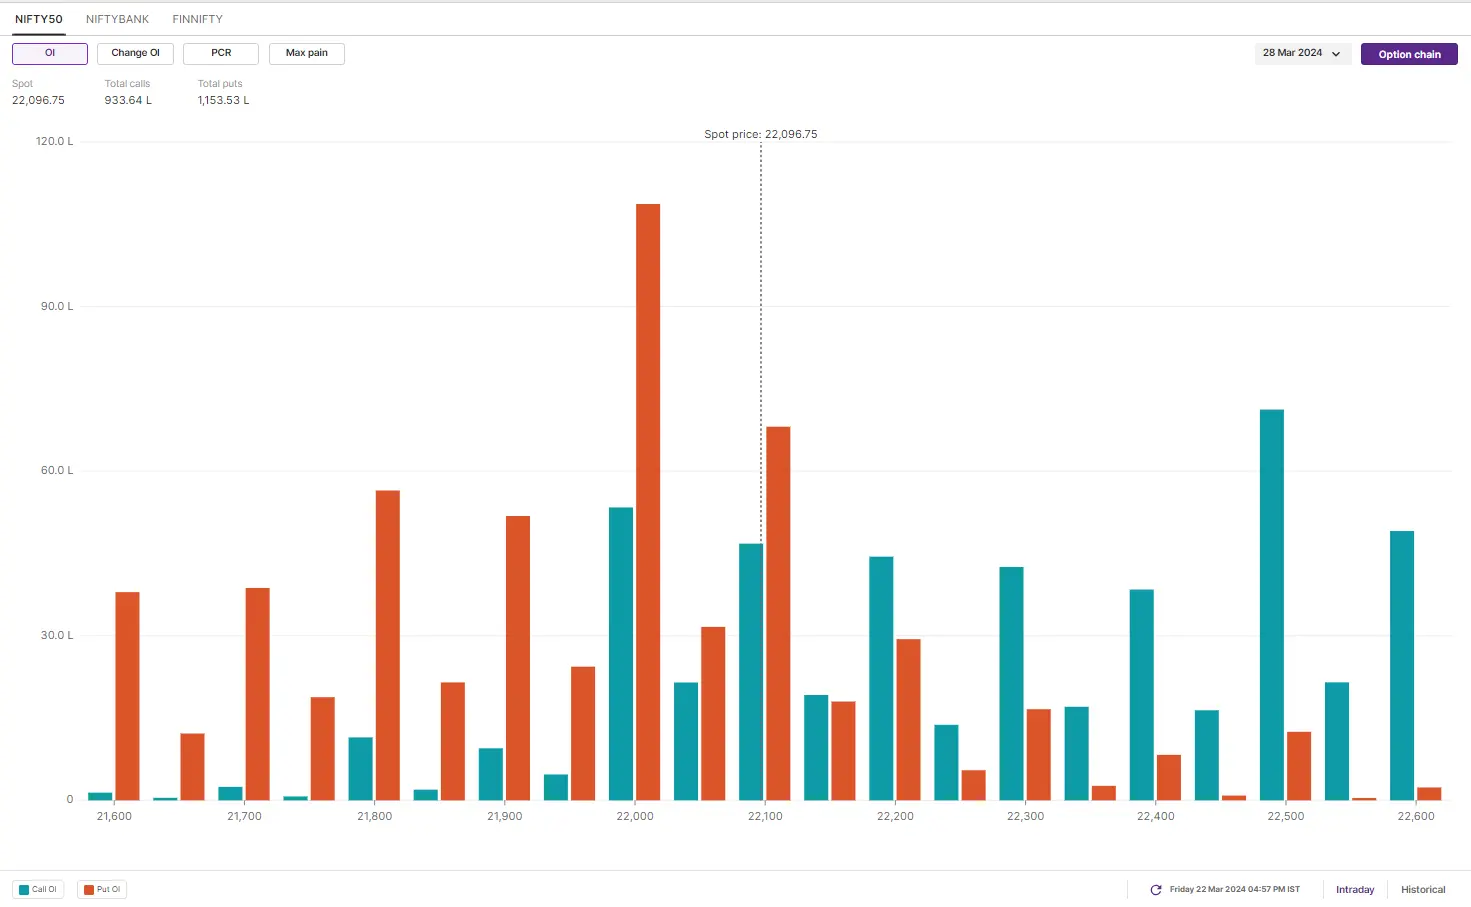
Open interest (OI) build-up for 28 March expiry shows significant call base at 22,500 and 22,000 strikes. On the other hand, the put writers have made base at 22,000 and 22,100 strikes. Based on the options data, traders are expecting NIFTY50 to trade between 21,700 and 22,600 this week.
BANK NIFTY
The BANK NIFTY extended its gains and closed higher for the second day in a row, forming a bullish candle on the daily chart. After a flat start, the index found support and gradually moved higher.
As highlighed in our previous blogs, the hammer candlestick pattern formed near its support zone of 50-DMA on 18th March indicated a potential reversal. Secondly, we also highlighted to our readers Hammer’s high (around 47,000) and low (around 46,000) as key levels to watch. Friday’s close above the hammer’s high indicates a positive momentum for the index.
With a truncated trading week ahead, experts point at 20-DMA, around 47,000 as the immediate resistance to watch for further gains. Support remains at 46,300.
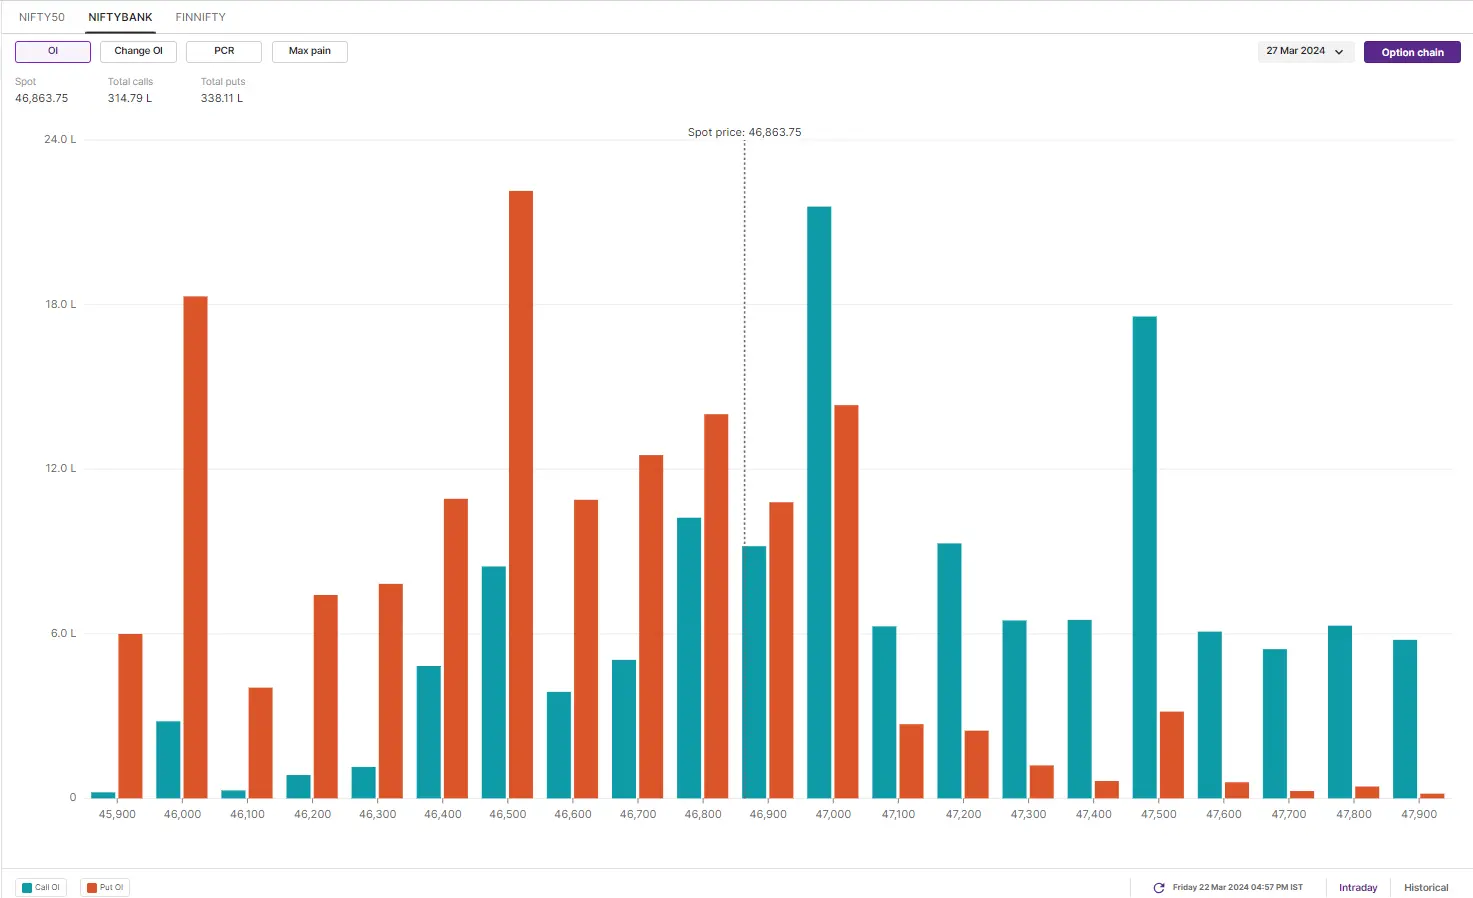
For BANK NIFTY's 27 March expiry, the open interest build-up shows a significant base at the 47,000 & 48,000 call option strikes and 46,500 & 46,000 put option strikes. Based on the open interest build-up, traders are eyeing BANK NIFTY’s trading range between 45,500 and 48,000 this week.
FII-DII activity
Stock scanner
In Futures and Options or F&O, long build-up means an increase in Open Interest (OI) along with an increase in price, and short build-up means an increase in Open Interest(OI) along with a decrease in price.

About The Author
Next Story