Market News
Trade setup for 13 May: NIFTY50 forms inside candle, volatility index soars above 18
.png)
5 min read | Updated on May 13, 2024, 08:47 IST
SUMMARY
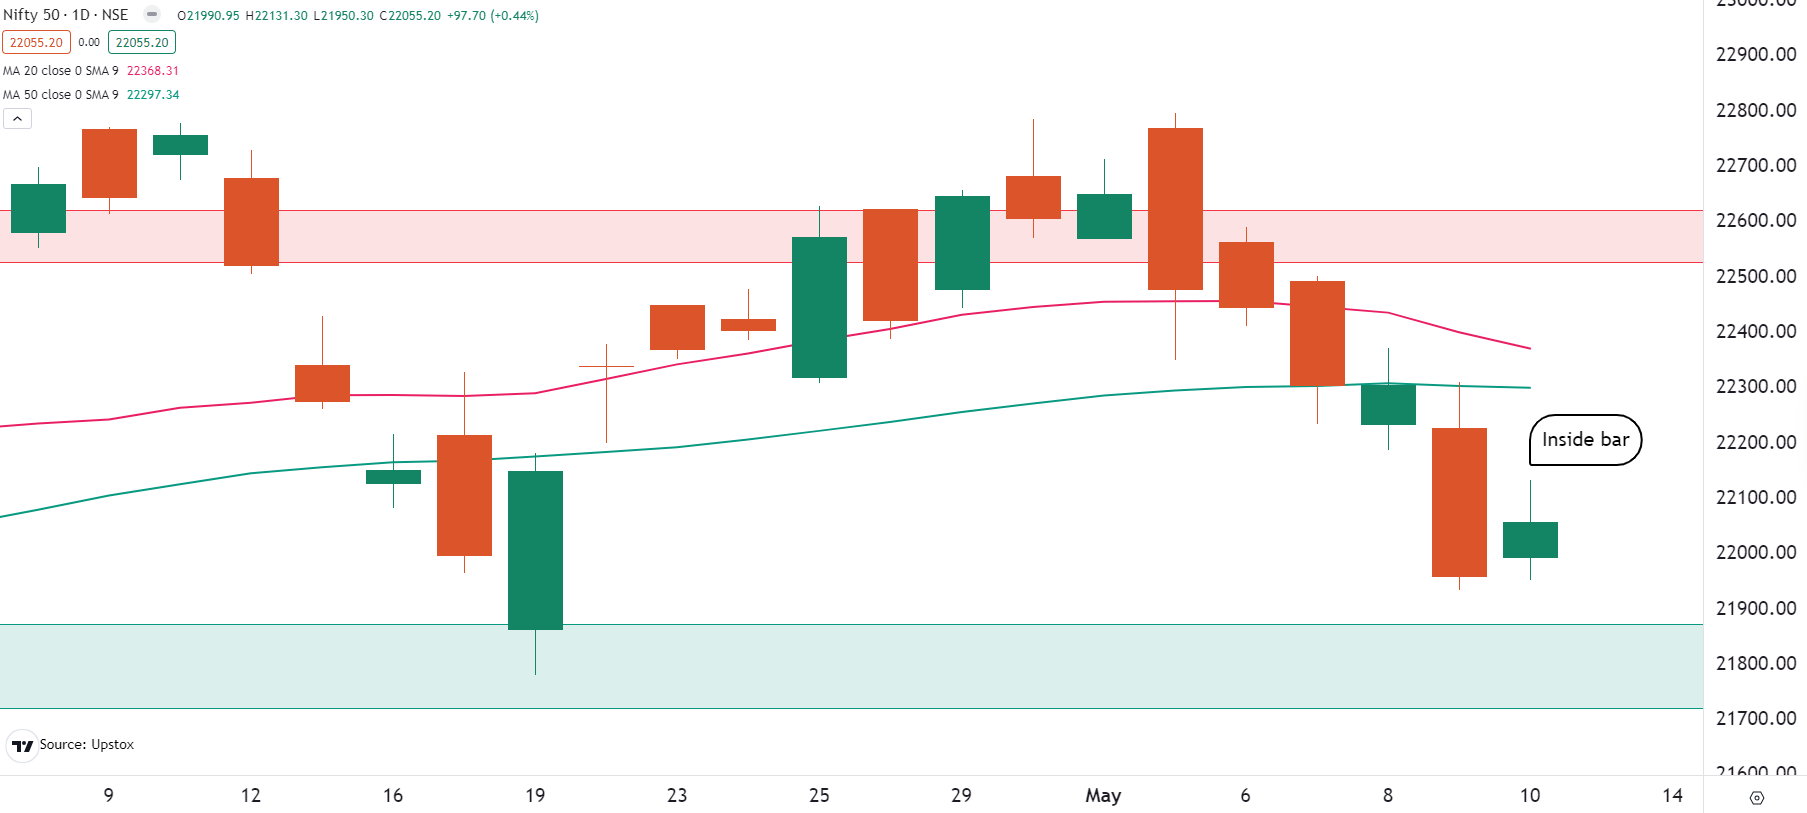
The NIFTY50 fell nearly 2% last week, but formed a inside candle on daily chart which is also know as bullish harami pattern. This is considered as a reversal pattern. The two-candle pattern needs to be confirmed with a close above the high of the previous candle.

The BANK NIFTY has been falling in a one way direction for the past 8 trading sessions
Asian markets update 7 am
The GIFT NIFTY is trading lower (-0.1%) than Friday’s close, suggesting a flat to negative start for the Indian equities today. Meanwhile, the Asian markets are trading in the red. Japan’s Nikkei 225 is down 0.5%, while Hong Kong’s Hang Seng index is down 0.6%.
U.S. market update
U.S. stocks closed higher on Friday despite a weaker-than-expected report showing U.S. consumer sentiment fell to a six-month low as expectations for near-term inflation rose. The Dow Jones Industrial Average was up 0.3% at 39,512, while the S&P 500 was up 0.2% at 5,222. The Nasdaq Composite closed flat at 16,340.
NIFTY50
May Futures: 22,140 (▲0.2%)
Open Interest: 4,72,185 (▼3.6%)
After a positive start, the NIFTY50 index traded in a narrow range and closed the Friday’s session higher. With the exception of the flat close on the 8 May, the index broke its five-day losing streak and formed a small positive candle on the daily chart.
Last week, the NIFTY50 index fell nearly 2% and formed an inside candle on the daily chart, indicating a pause in the recent sharp decline. This pattern is also known as a bullish Harami pattern, which is also considered as a bullish reversal pattern.
This two-candlestick pattern follows a downtrend and consists of a large red candle followed by a smaller green candle that is completely contained within the body of the first candle. However, traders wait for the confirmation of the pattern, which is confirmed if the next candle closes above the high of the bullish harami candle.

Looking at the charts, the immediate support for the index is at between 21,700 and 21,800 zone, while the resistance remains at 22,500. A close above or below these levels and zone will provide more directional clues.
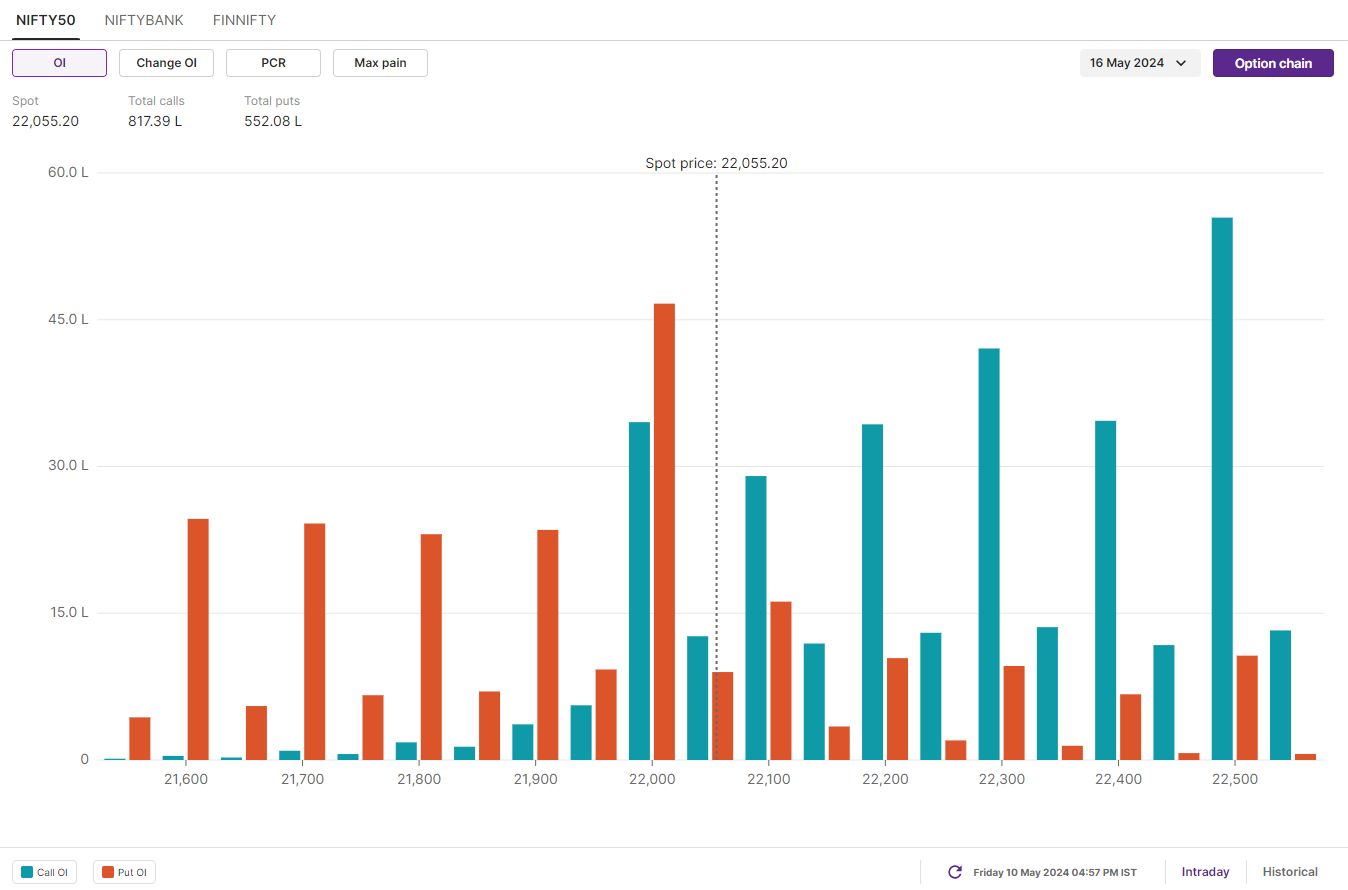
As per the open interest (OI) data of 16 May expiry, the significant call OI is placed at 22,500 strikes, while the put options base is spread between 22,000 and 21,500 strikes. Based on the options data, traders are expecting NIFTY50 to trade between 21,800 and 22,550.

BANK NIFTY
May Futures: 47,607 (▼0.1%)
Open Interest: 1,58,237 (▼1.0%)
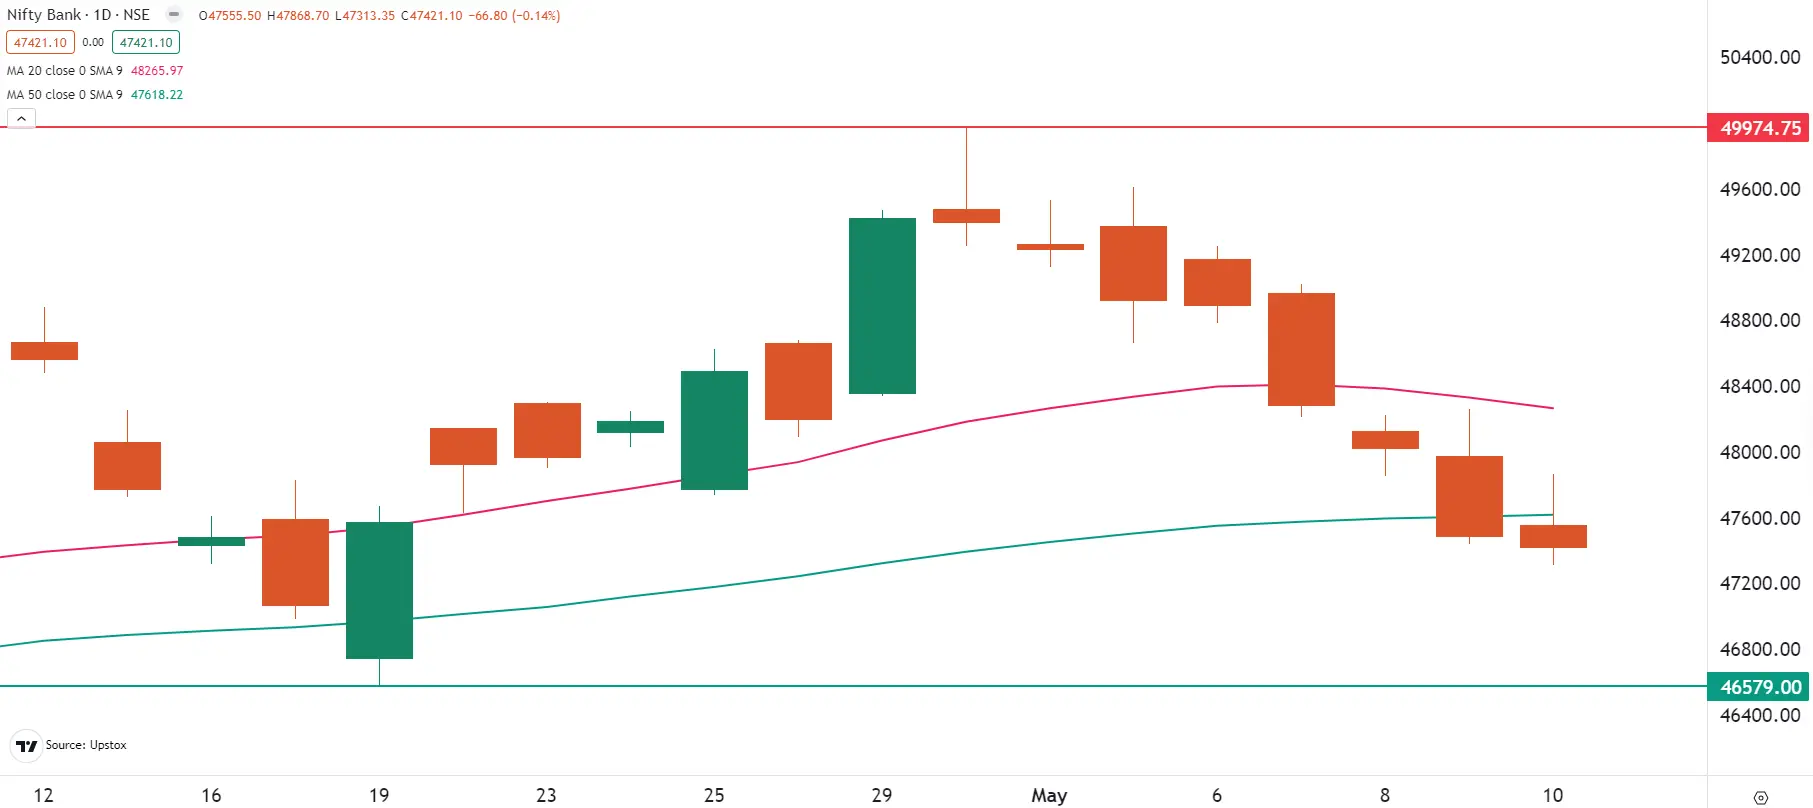
The BANK NIFTY closed in the red for the eighth consecutive session and underperformed the NIFTY50 throughout the week. The index broke and closed below several support levels of 20 and 50 day moving averages (DMA) and fell 3% last week on selling pressure in banking heavyweight HDFC Bank, which declined 4% last week.
The BANK NIFTY has been falling in a one-way direction for the past 8 trading sessions, and is now technically in the oversold territory. The index has formed an inverted hammer pattern on the daily chart near its 50 DMA, which is seen as a reversal pattern. However, traders are waiting for the next day's close to confirm the pattern. If the next day's close is higher than the inverted hammer, the pattern will be confirmed.

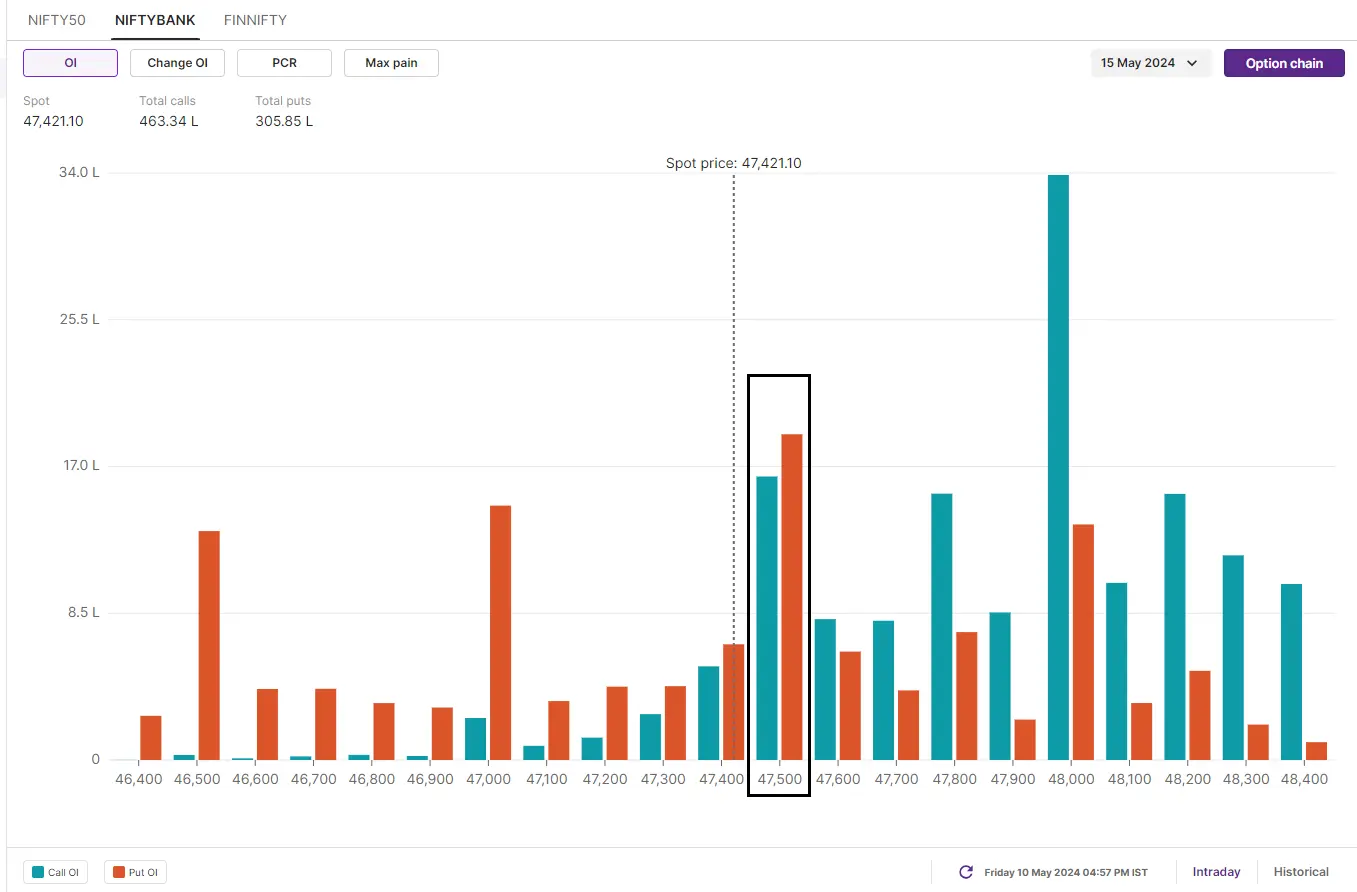
Technically, the BANK NIFTY has strong support between 46,500 and 46,300 zone and the resistance remains at 48,200-mark. The open interest for the 15 May expiry has the highest call base at 48,000 and the put base is spread between 47,500 to 46,500. Based on the options data, traders are expecting BANK NIFTY to trade between 46,500 and 48,900.

FII-DII activity
Stock scanner
Long build-up: Polycab, Dr. Lal PathLabs, Astral, Escorts Kubota, Hindustan Copper and ABB
Short build-up: Bank of Baroda, Birlasoft, ACC and Cipla
Under F&O ban: Balrampur Chini, Canara Bank, GMR Infra, Hindustan Copper, Idea ,Punjab National Bank, Steel Authority of India (SAIL) and Zee Entertainment
Out of F&O ban: Aditya Birla Fashion and Retail and Piramal Enterprise
In Futures and Options or F&O, long build-up means an increase in Open Interest (OI) along with an increase in price, and short build-up means an increase in Open Interest(OI) along with a decrease in price.
Source: Upstox and NSE.
Disclaimer: Derivatives trading must be done only by traders who fully understand the risks associated with them and strictly apply risk mechanisms like stop-losses. The information is only for consumption by the client and such material should not be redistributed. We do not recommend any particular stock, securities and strategies for trading. The securities quoted are exemplary and are not recommendatory. The stock names mentioned in this article are purely for showing how to do analysis. Take your own decision before investing.
Next Story


