Market News
NIFTY50 ends FY24 on a positive note, weekly chart signals further gain
3 min read | Updated on March 28, 2024, 18:46 IST


SUMMARY
The NIFTY50 showed positive momentum on both the monthly and weekly charts. On both the timeframes, the index closed above the previous candle high, indicating strong upward momentum heading into April.
Stock list
NIFTY50 ends FY24 on a positive note, weekly chart signals further gain.
Indian markets closed the last day of FY24 on a high note, mirroring positive global cues and broad-based buying across sectors. The NIFTY50 initially crossed the 22,500-mark intraday but gave up most of its gains to close nearly 1% higher at 22,326. Similarly, the SENSEX gained 1% to close at 73,651.
In the F&O series for March, the NIFTY50 recorded a gain of 1.6% and for the financial year 2024, the index recorded gains of 28.6%.
The broader market indices also extended their winning streak on Thursday, with the NIFTY Midcap 100 advancing 0.5% and the Smallcap 100 index closing flat with a positive bias.
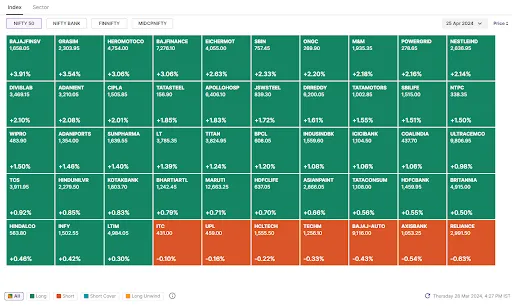
All major sectoral indices closed in the green except for Media (-0.7%). PSU Banks (+2.6%), Automobiles (+1.2%) and Metal (+1.2%) were the top gainers.
As mentioned in our morning blog, the NIFTY50 crossed its 20-day moving average on the daily chart and subsequently extended its gains to 22,500. In today's morning trade setup blog, we also highlighted the confirmation of the inverted hammer on the daily chart for 27 March, which is seen as a bullish reversal signal.
With the index now trading above all the key daily moving averages (20 and 50), experts believe that the NIFTY50’s new trading range has shifted to 22,000 and 22,500. The immediate support for the index is at 22,200, coinciding with its 20-DMA, while the resistance remains at an all-time high (22,526).
Key highlights of the day:
Top traded futures contracts

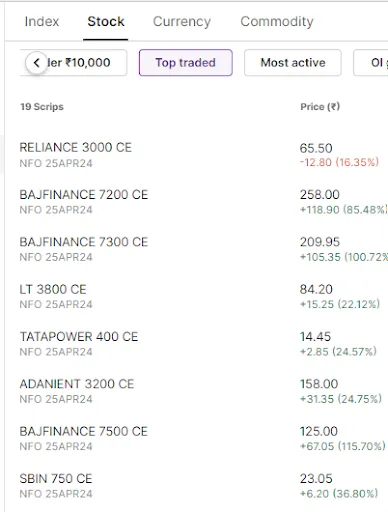
Top traded stock options contracts
4 trading insights from NIFTY 200🔍
See you on Monday!
About The Author
Next Story


