Market News
Will NIFTY50 hold the 20-DMA? Private bank woes cloud the outlook

4 min read | Updated on February 09, 2024, 07:37 IST


SUMMARY
Market experts anticipate that the NIFTY50 is likely to trade with a negative bias. On the daily chart, resistance remains strong at the all-time high of 22,126. Support levels are expected to be around the 20-day moving average (around 21,700) and the 50-day moving average (around 21,400). Traders can watch the price action near 20-DMA for further directional clues.
.jpg)
How will Nifty50 open today
Indian markets are set for a cautious start today, with the GIFT NIFTY trading 55 points lower. Meanwhile, Asian markets are trading mixed. Japan's Nikkei 225 broke through the 37,000 mark for the first time in 34 years, rising 0.5%. Hong Kong's Hang Seng Index was down over 1%.
U.S. stocks ended the day on a positive note, buoyed by upbeat earnings reports from Disney and other companies. The Dow Jones Industrial Average rose 0.1% to a record high of 38,276, while the S&P 500 inched closer to the 5,000 mark, closing flat at 4,997. The tech-heavy Nasdaq Composite fared slightly better, gaining 0.2% to end at 15,793.
- February Futures: 21,814 (▼0.7%)
- Open Interest: 2,45,837 (▲1.4%)
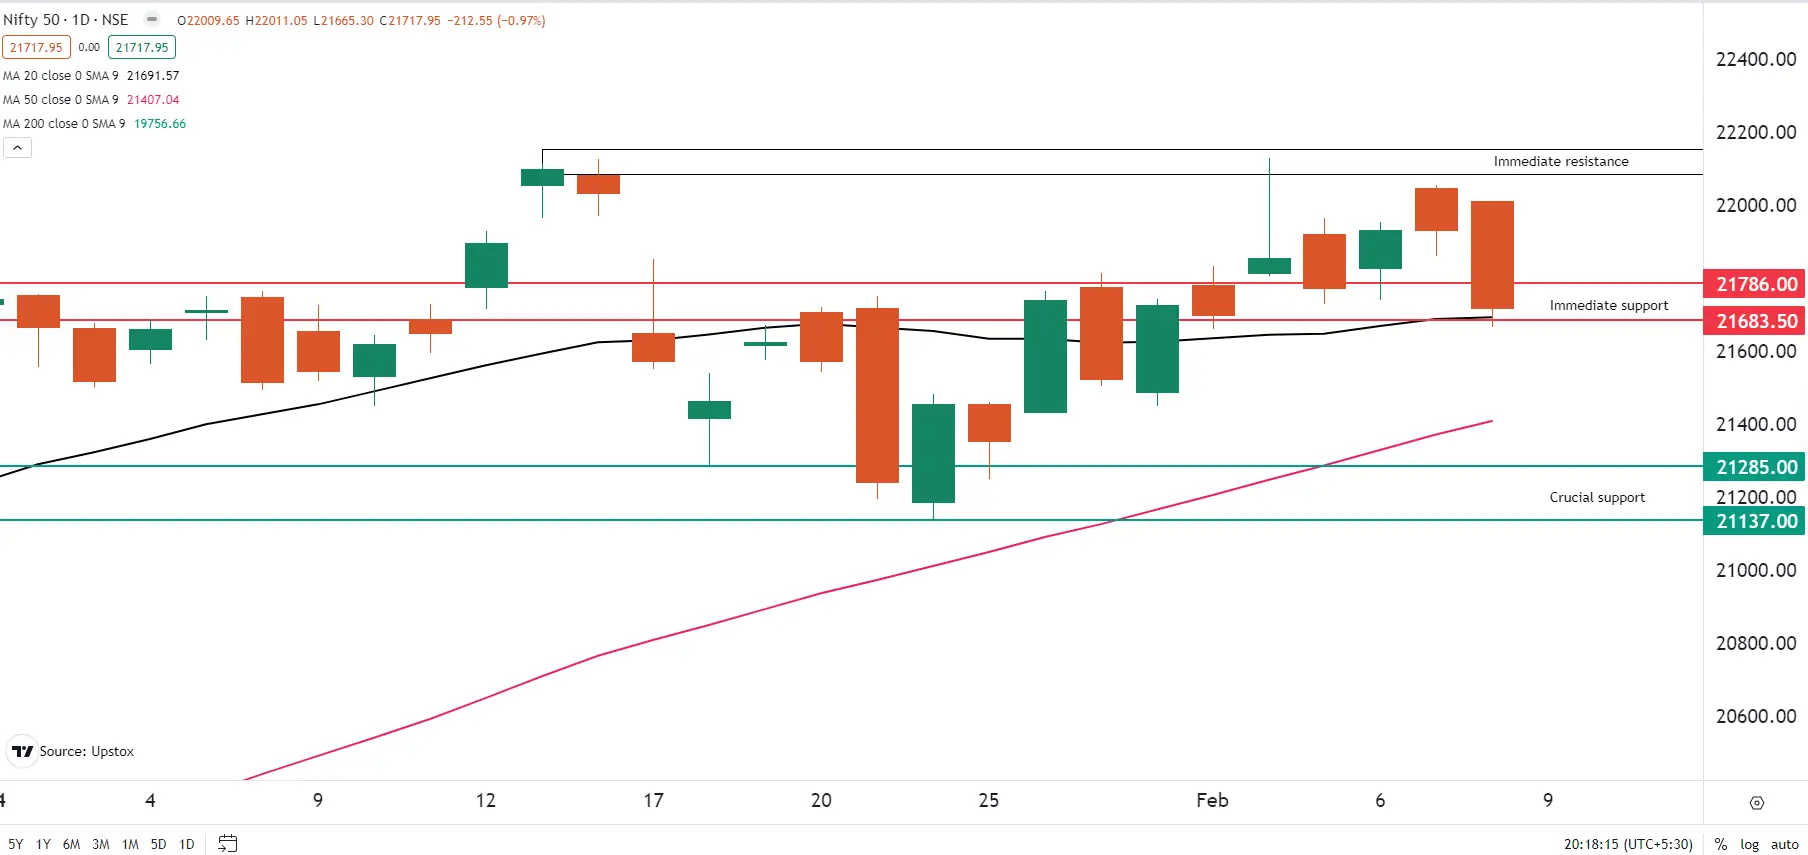
The NIFTY50 came under heavy selling pressure on its weekly expiry day, shedding almost 1%. Despite an initial bounce, the index turned sharply lower, losing over 300 points from its intraday high. This decline was fueled by renewed selling in private banking heavyweights, with FMCG giant ITC joining the selling spree. The drop pushed the index to its 20-day moving average.
Market experts anticipate that the NIFTY50 is likely to trade within a range in the near term, with a slight negative bias. On the daily chart, resistance remains strong at the all-time high of 22,126. Support levels are expected to be around the 20-day moving average (around 21,700) and the 50-day moving average (21,400). Traders may monitor the price action near these key levels for potential trading opportunities, and refer to the attached chart for further guidance.
💡It's important to note that the NIFTY50 formed a bearish engulfing candle on the weekly chart on the 15th of January. Despite the recent declines, the index has yet to close below the low of this bearish pattern, which sits at 21,285 on the weekly timeframe.
Open interest data for the NIFTY50's 15th February expiry has significant call base at the 22,000 and 22,500 strikes. Conversely, the 21,000 and 21,500 strikes hold the maximum put base. This suggests that market participants expect the NIFTY50 to trade in a range of 21,200-22,200 for 15 February expiry.
 You can track open interest of the NIFTY50 here: https://pro.upstox.com/
- February Futures: 45,212 (▼1.8%)
- Open Interest: 2,20,765 (▲3.9%)
The BANK NIFTY witnessed a brutal sell-off following the RBI policy announcement, plunging over 1,000 points from its intra-day high. This decline was primarily driven by heavy selling in the private banking majors.
As highlighted in yesterday's trade setup blog, the index had the potential to break in either direction following the RBI’s announcement. Notably, it has now found temporary support at its 200 DMA (around 44,800), but more importantly, it closed below the budget day low of 45,600.
Experts believe that the index may remain under pressure due to the ongoing sell-off in private banking giants. It's worth noting that the BANK NIFTY has already tested its 200 DMA before and a close below this level could further weaken the outlook.

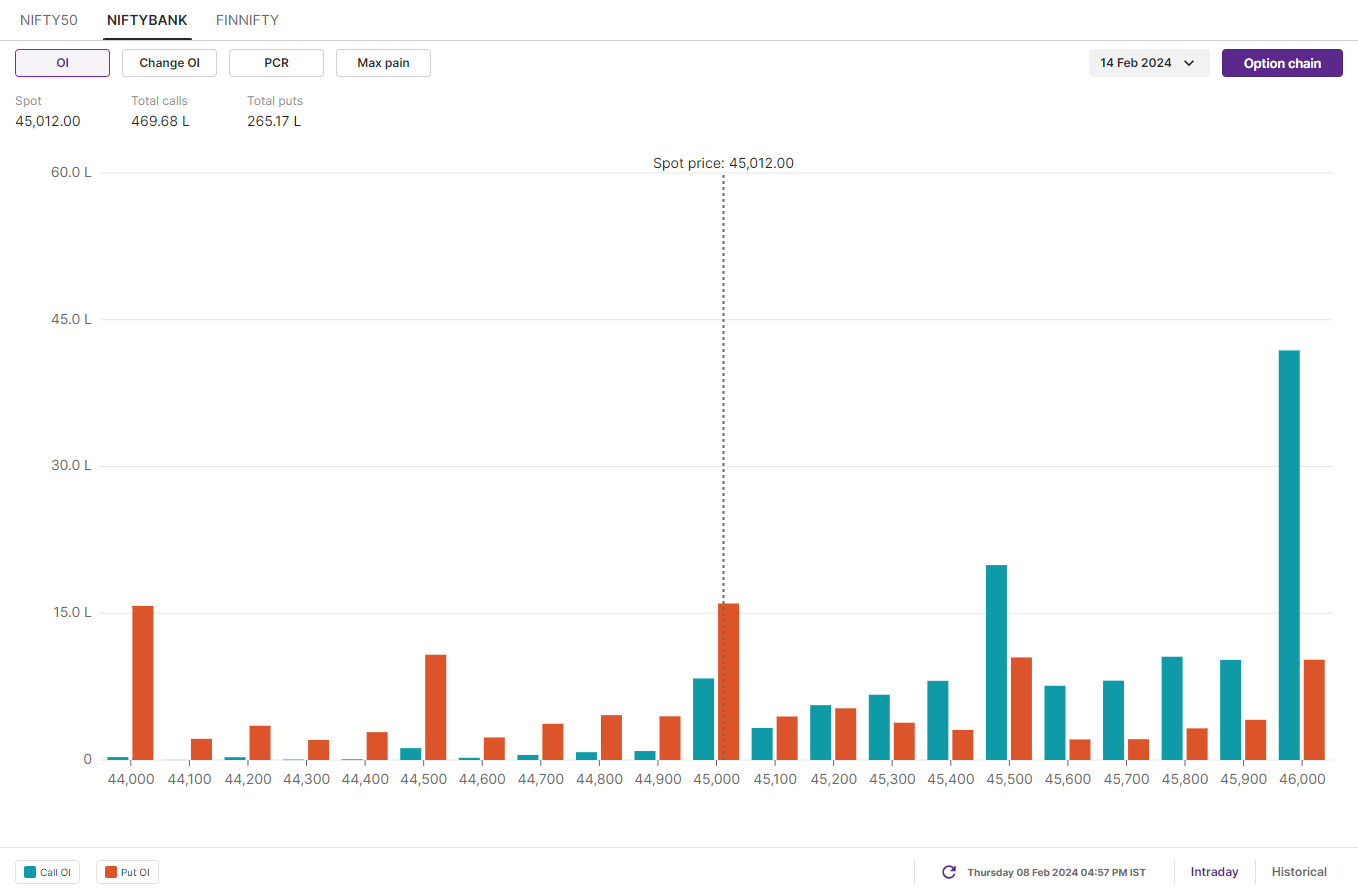
For BANK NIFTY's February 14th expiry, the options data shows high open interest at the 46,000 & 45,500 call option strikes and 43,000 & 44,000 put option strikes. As per the open interest, traders eye BANK NIFTY trading range between 46,500 and 43,400 for February 14th expiry.
In Futures and Options or F&O, long build-up means an increase in Open Interest (OI) along with an increase in price, and short build-up means an increase in Open Interest(OI) along with a decrease in price.
Source: Upstox and NSE.
About The Author
Next Story


