Market News
BANK NIFTY expiry: Doji hints at indecision, key levels to watch
.png)
4 min read | Updated on April 03, 2024, 08:12 IST


SUMMARY
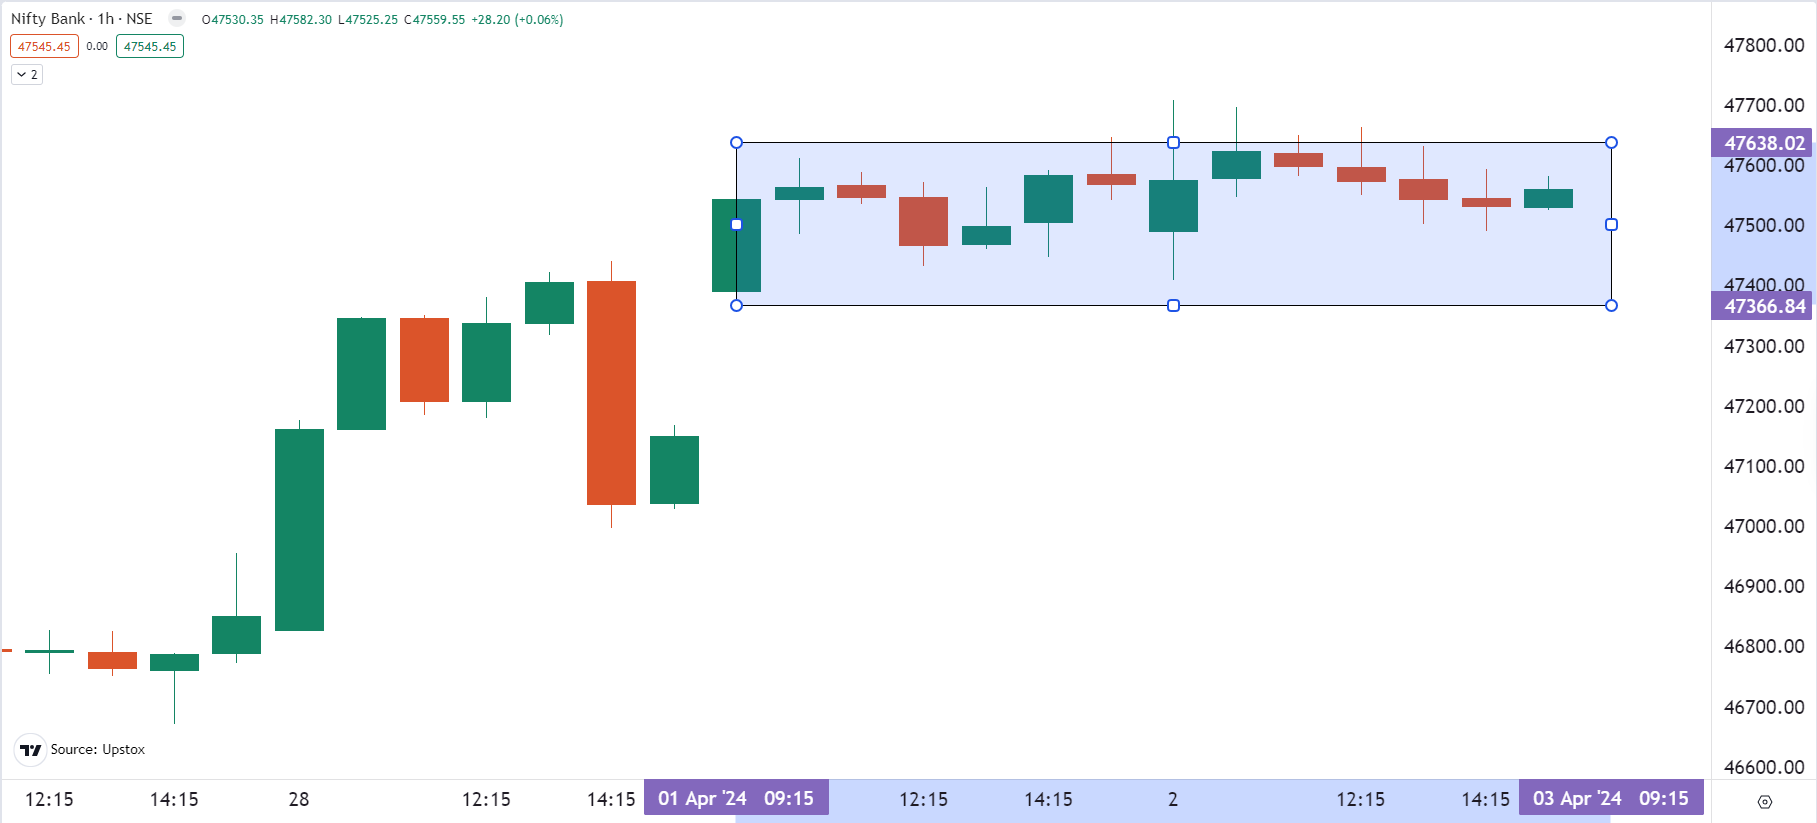
The BANK NIFTY is consolidating between 47,600 and 47,300 mark since 1 April. Traders should monitor the price action in this range closely ahead of the RBI’s Monetary policy decision. A close above or below this range will give further directional clues.
The winning streak of BANK NIFTY came to a halt after three days, closing last session flat.
Asian markets update 7 am
Tracking weak global cues, the GIFT NIFTY is pointing to a gap down (-0.5%) start for the Indian equities today. Other Asian markets are also trading lower. Japan's Nikkei 225 is down 1.1%, while Hong Kong's Hang Seng Index shed 0.6%.
U.S. market update
U.S. stocks fell on Tuesday as the 10-year Treasury yield rose to 4.36% and Brent crude oil traded above $88 a barrel for the first time since October 2023. In addition, hotter-than-expected manufacturing data prompted traders to cut their bets that the Fed will cut interest rates in June to 63% from 70% last week.
The Dow Jones dropped 1% to 39,170, while the S&P 500 slipped 0.7% to 5,205. The Nasdaq Composite fell 0.9% and closed at 16,240.
NIFTY50
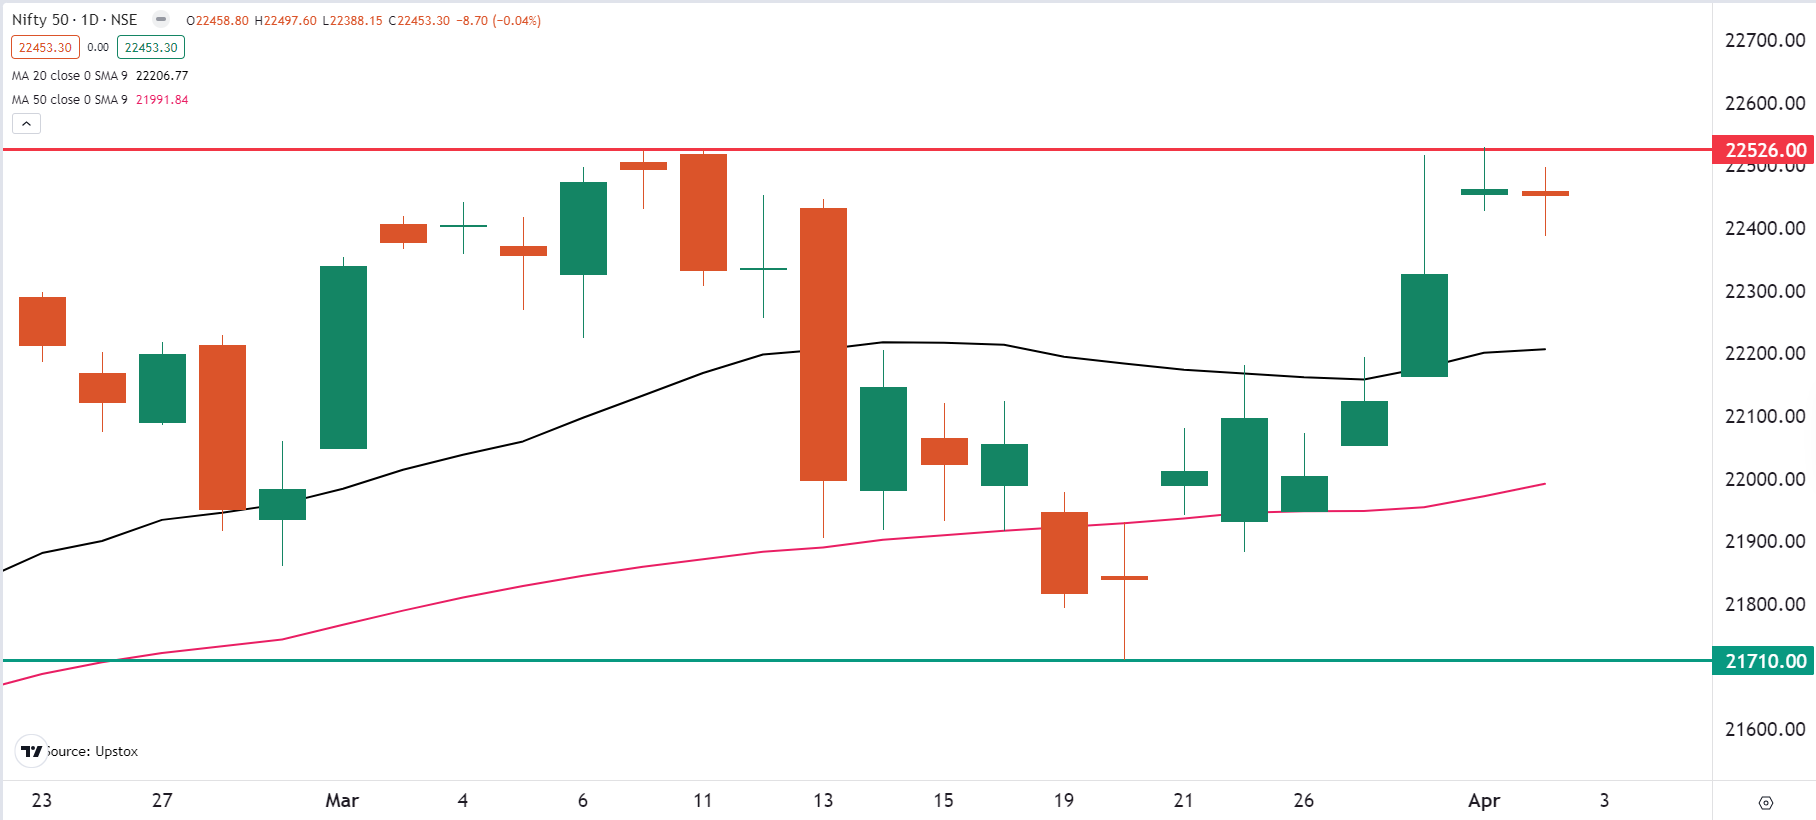
The NIFTY50 began Tuesday's session flat, mirroring a weak handover from Wall Street. This marks the second consecutive day of narrow range of trading, with the index forming a doji candlestick pattern on the daily chart, highlighting investor decision.
Although the NIFTY50 is above its major daily moving averages (20 and 50), indicating a positive long-term trend, it faces an immediate hurdle between 22,500 and 22,600. Support lies in the 22,350-22,300 zone. Experts believe that the current trading range is between 22,000 and 22,500, with a decisive daily close above 22,500 potentially triggering further gains.
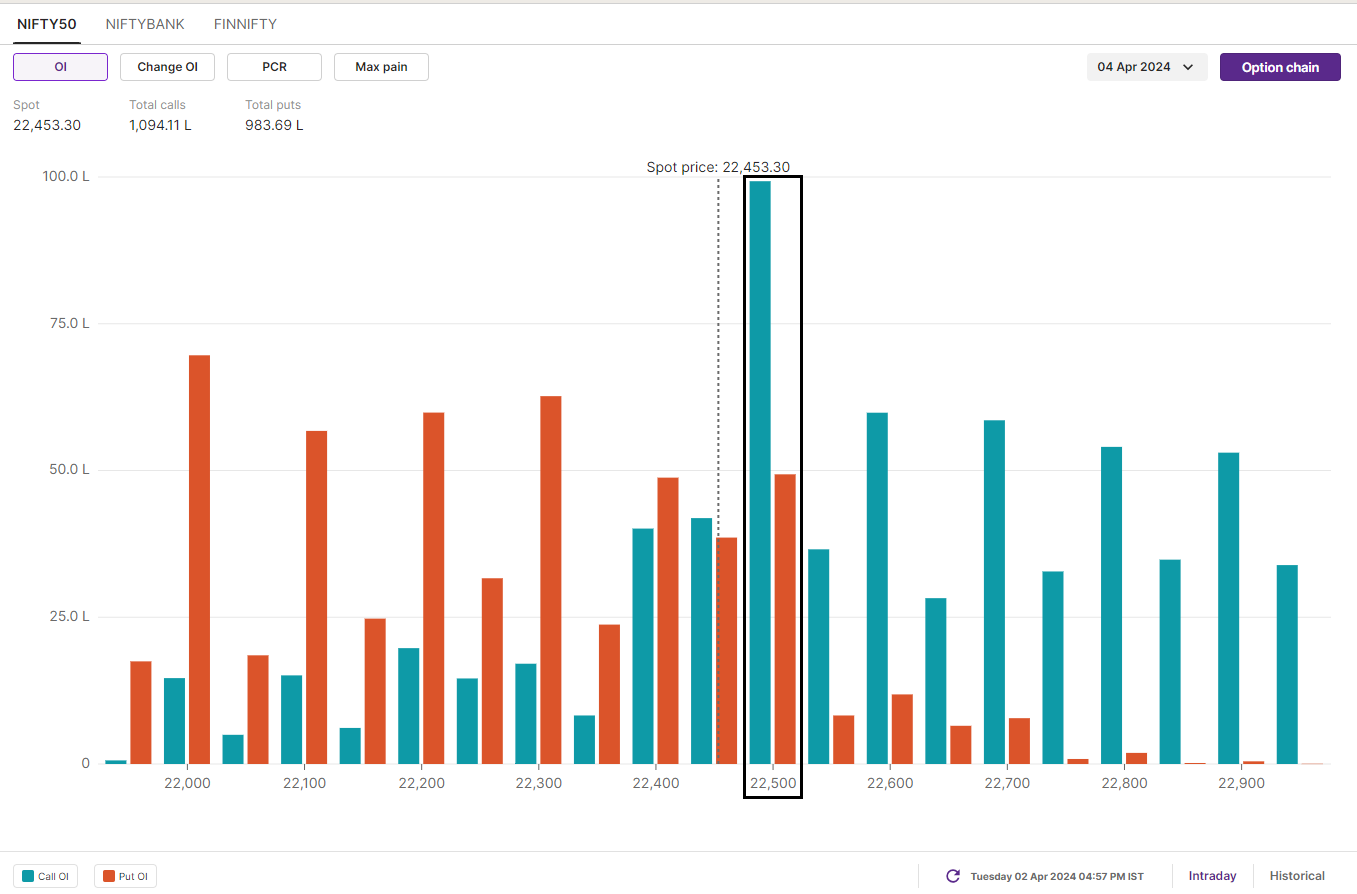
The Open Interest (OI) build-up for the 4 April expiry shows a significant call base at 22,500 and 23,000 strikes. On the other hand, the put base remained at 22,000 and 22,300 strikes. Based on options data, traders expect the NIFTY50 to trade between 22,100 and 22,600 this week.
BANK NIFTY
The BANK NIFTY's winning streak came to a halt after three days, closing Tuesday's session flat. This consolidation is reflected in a doji candlestick pattern on the daily chart, suggesting a temporary pause or indecision among investors.
On the hourly chart, the index is consolidating between 47,600 and 47,300 mark since 1 April. Traders should monitor the price action in this range closely ahead of the RBI’s Monetary policy decision. A close above or below this range will give further directional clues of the trend. The immediate support for the index is at 47,300, while the resistance is at 47,700 mark.
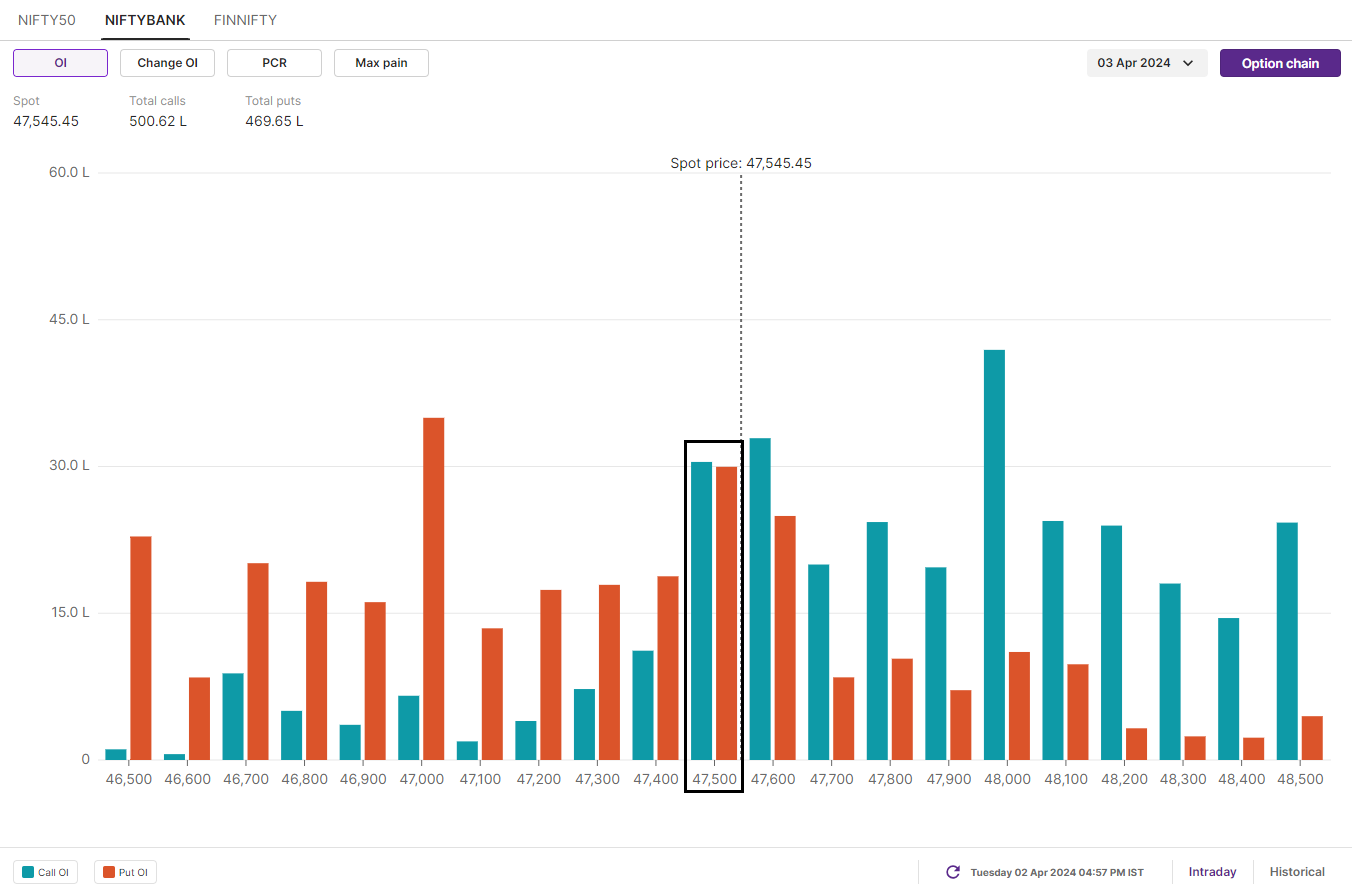
Open interest (OI) build-up for today’s expiry shows a significant call base at 48,000 and 47,600 strikes. On the other hand, the base of put writers is at 47,000 and 47,500 strikes. Based on the options data, traders are expecting BANK NIFTY to trade between 46,900 and 48,000.
FII-DII activity
Stock scanner
In Futures and Options or F&O, long build-up means an increase in Open Interest (OI) along with an increase in price, and short build-up means an increase in Open Interest(OI) along with a decrease in price.
Source: Upstox and NSE.
Disclaimer: Derivatives trading must be done only by traders who fully understand the risks associated with them and strictly apply risk mechanisms like stop-losses. The information is only for consumption by the client and such material should not be redistributed. We do not recommend any particular stock, securities and strategies for trading. The securities quoted are exemplary and are not recommendatory. The stock names mentioned in this article are purely for showing how to do analysis. Take your own decision before investing.

About The Author
Next Story