Market News
Weekly market outlook: RBI policy, auto sales & other key events to watch in first week of FY25
.png)
7 min read | Updated on April 01, 2024, 13:18 IST


SUMMARY
RBI's policy decision, auto sales data and U.S. employment figures will be in focus in the coming week. These factors will determine the market direction. Traders should keep a close eye on the NIFTY50, as a break above the all-time high of 22,526 could extend the rally, while a break below 21,700 could signal a trend reversal.
RBI policy, auto sales & other key events to watch this week
Indian markets continued their upward trend for the second week, buoyed by positive global cues and broad based buying across sectors with the exception of IT stocks. The NIFTY50 rose 1% to end the week at 22,326, while the SENSEX gained 1.1% to end the week at 73,651. For the financial year 2024, the NIFTY50 has gained 28.6%.
Financial year 2024 proved to be a phenomenal year for the Indian markets, particularly for mid and small cap stocks. The NIFTY Midcap 100 index surged 60% in FY24, while the NIFTY Smallcap 100 index jumped 70% in FY24. Even after the profit-booking in March, these indices remained the frontrunners.
On a sectoral basis, all the indices posted gains in FY24, with Realty (+133%) and PSU Banks (+89%) being the strongest performers. This positive momentum continued in the March F&O series, with the NIFTY50 closing above previous month’s high and registering 1.6% gain, suggesting a positive momentum for the April series.
Index breadth- NIFTY50
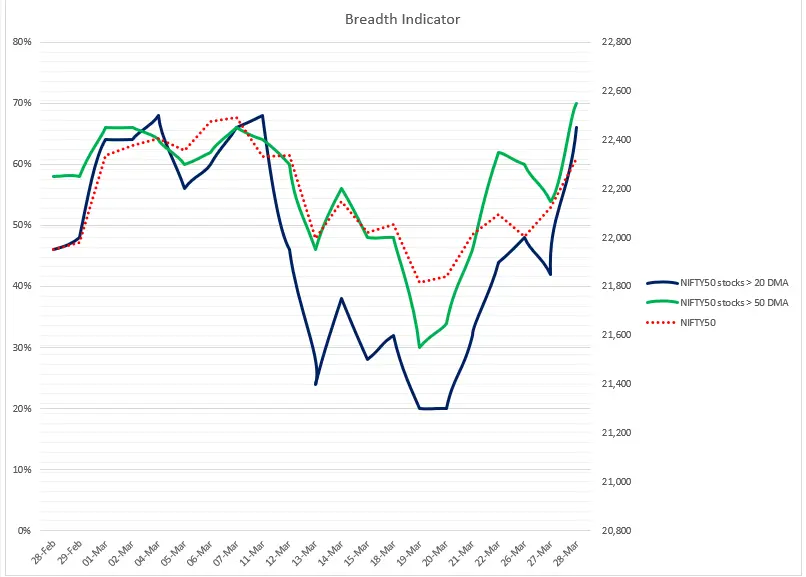
We have refined our breadth indicator to provide a more comprehensive view of the market strength. Previously, it only tracked the number of NIFTY50 stocks trading above their 20-day moving average (DMA). Now, it also highlights how many stocks are above their 50-DMA.
As you can see in the chart below, a healthy 66% of the NIFTY50 stocks are trading above their 20-DMA and 70% of stocks are above their 50-DMA. This suggests broad participation and the strength of the market.
Going forward, we will be closely monitoring the crossover of these two parameters (blue and green line). A sustained increase in the number of stocks trading above their 20-DMA will signal further strength and momentum in the market.
FIIs positioning in the index
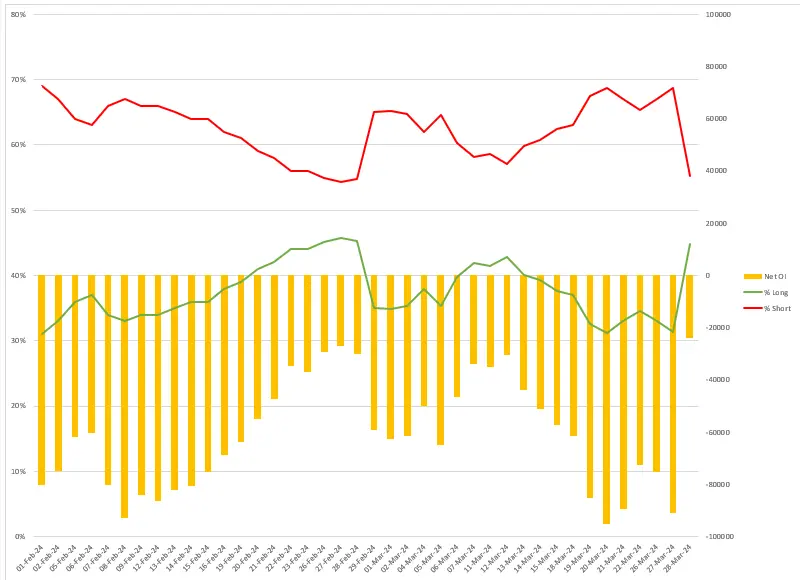
Foreign Institutional Investors (FIIs) started the April F&O series with a long to short ratio of 45:55 in the index futures. Currently, FIIs' net short open interest (OI) in the index futures stands at 23,851 contracts, indicating a range-bound positioning. Prior to the rollover to the April series, FIIs were net short by 90,796 contracts till 27 March.
However, as we have observed in our previous blogs, they gradually increase and decrease their OI in the index futures, which again highlights the trend of the market. As you can see in the chart below, FIIs maintained a net short OI of nearly 80,000 contracts from the 19 to the 27 March, but unwound all their bets on the day of the monthly expiry, leading to a short-covering rally.
We advise our readers to keep a close watch on any further trimming or addition of net OI by FIIs to get a clear understanding of the ongoing trend.
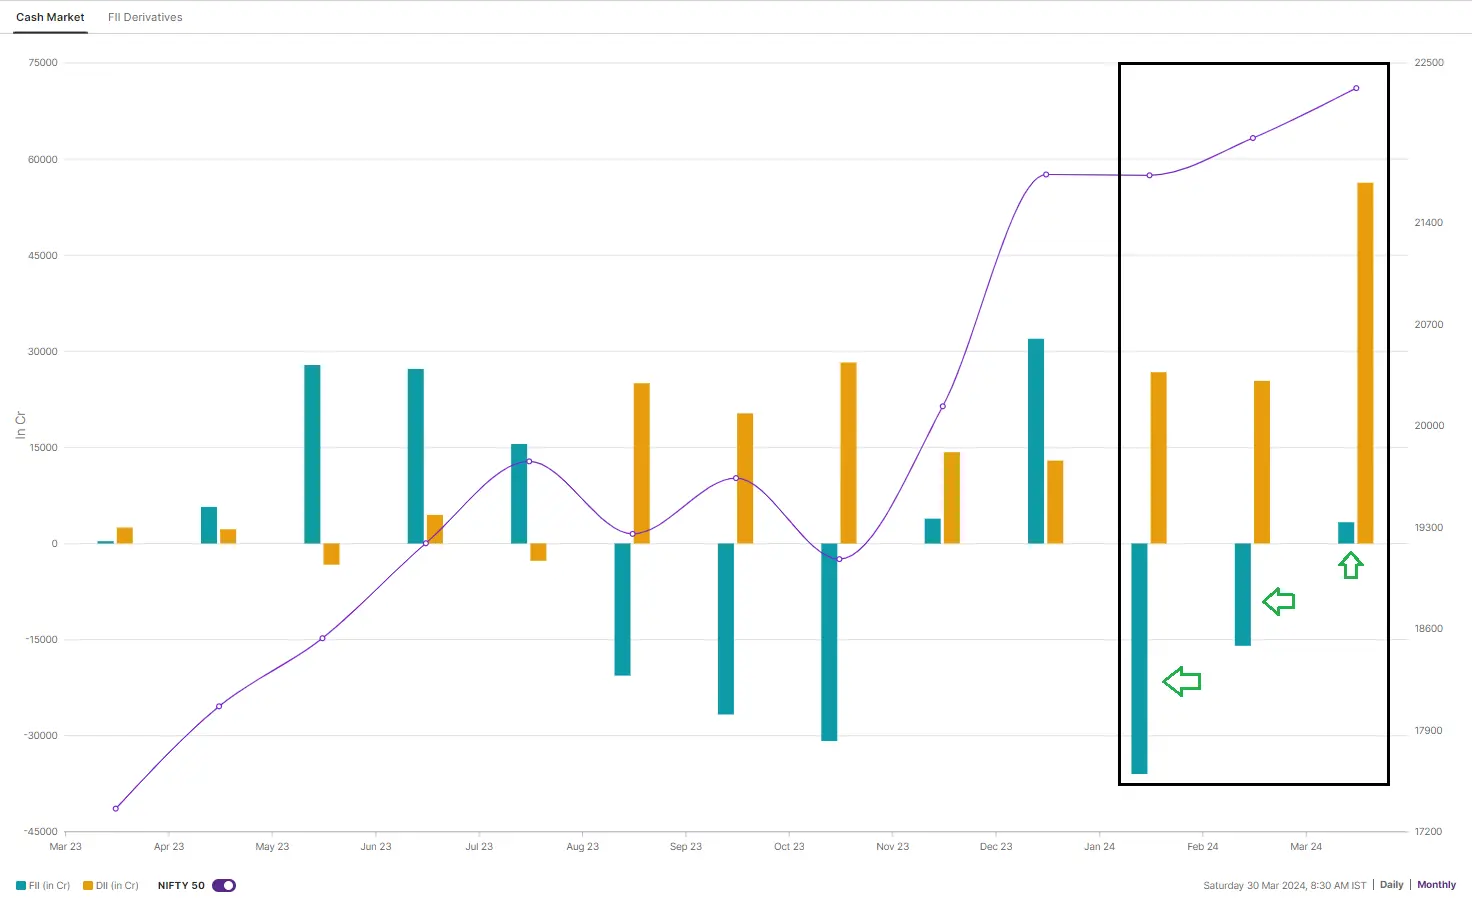
In the cash market, FIIs turned net buyers in March, ending a two-month selling spree. As you can see from the chart below, after being net sellers in both January and February, the FIIs were net buyers to the tune of ₹3,314 crore in March. They sold shares worth ₹51,939 crore in January and February.
On the contrary, Domestic Institutional Investors (DIIs) bought the biggest pie in March 2024, buying ₹56,311 crore of shares, the highest since March 2020.
F&O - NIFTY50 outlook
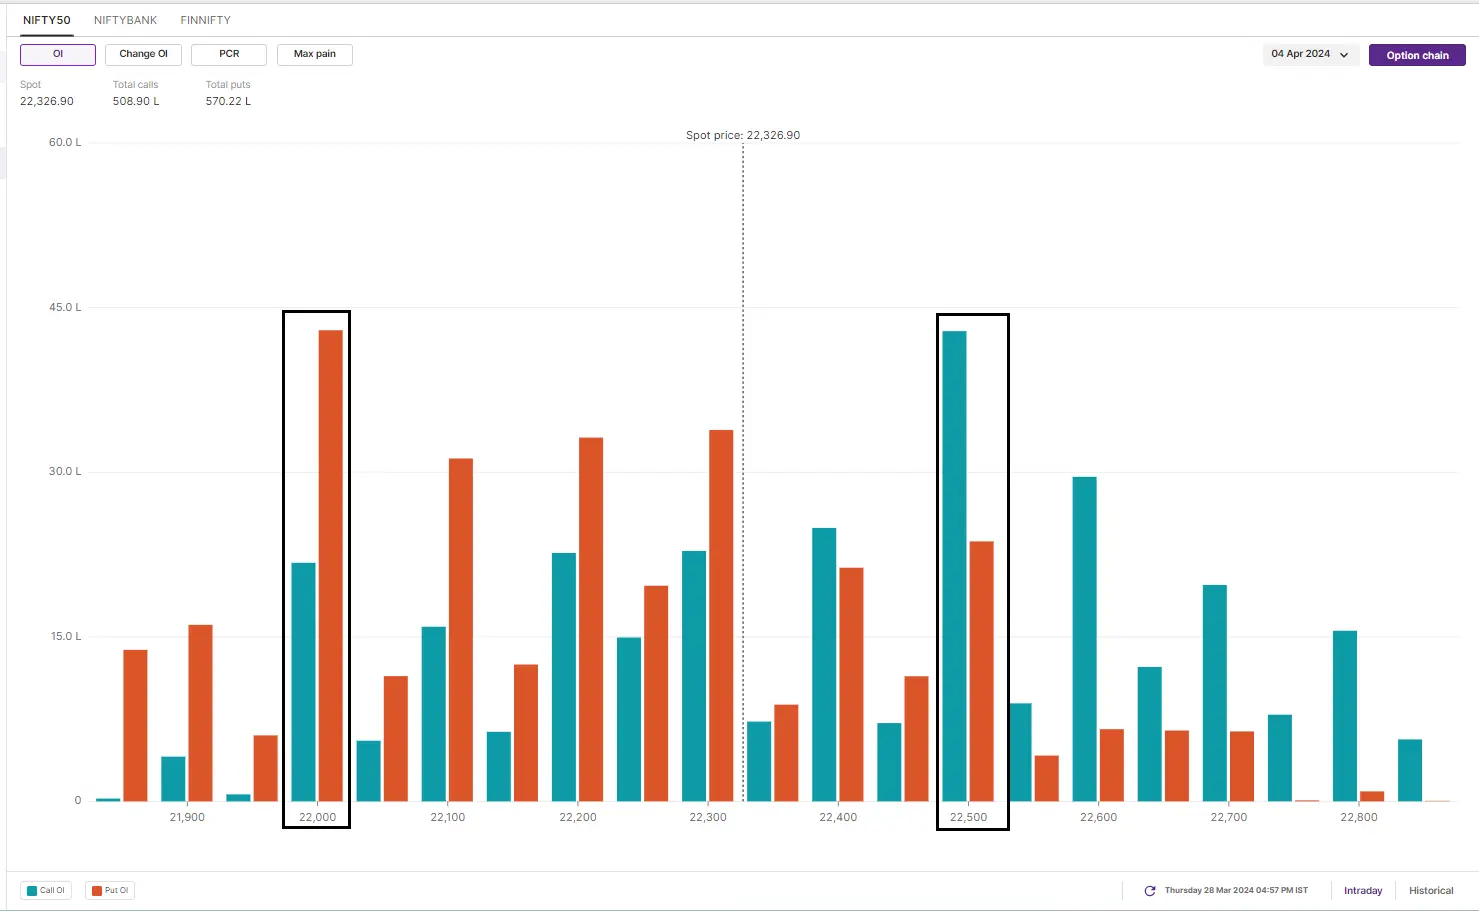
Initial open interest for the 4 April expiry in NIFTY50 shows a concentration of call options at the 22,500 and 23,000 strikes. Put options have a strong base at the 22,000 and 22,200 strikes. Based on the open interest, market participants expect the NIFTY50 to trade between 21,700 and 22,800 next week.
In the last blog before the holiday-shortened week, we highlighted to our readers that the index reversed the bearish engulfing candle on the weekly chart, indicating support based buying near the 50-DMA.
This week, the index not only closed above the previous week’s high but also confirmed the hammer candlestick pattern. A hammer pattern suggests a potential trend reversal and it is confirmed if the price closes higher in the following week.
Looking ahead, the 21,700 and 21,900 zone will act as a crucial support zone, while the resistance remains at all-time high (22,526).

F&O - BANK NIFTY outlook
For the 3 April expiry, significant call OI was seen on the BANK NIFTY at 47,500 and 48,000 strikes, while maximum put writing was seen at the 47,000 and 46,700 strikes. Based on options data, traders expect the BANK NIFTY to trade between 45,800 and 48,200 next week.

Building on last week’s analysis, the BANK NIFTY also confirmed the bullish hammer candlestick on the weekly chart. This reversal pattern was formed after the banking index found support near the 46,300 and 46,500 zone, which also coincides with its 50-DMA. Experts believe that this zone will act as immediate support for the index.
Following the hammer confirmation, the BANK NIFTY closed above previous week’s high, solidifying the bullish momentum. The immediate resistance is at 47,200 mark
As we informed our readers last week, the NIFTY50 has negated the bearish engulfing pattern. We believe that the NIFTY50 is at a crucial stage as the index has been consolidating between 21,700 and 22,500 since February. During this consolidation, the NIFTY50 has seen a maximum correction of 3.5% from its peak and a strong recovery from its lows.
According to the experts, after two months of consolidation, traders should keep a close eye on the price action near the index's all-time high (22,526). A close above this level on the daily timeframe could extend the bullish momentum. On the other hand, a close below 21,700 will change the direction of the trend.
And we'll keep you updated on the changes and important developments via our morning trade setup blog, which is available every day before the market opens at 8 am.
About The Author
Next Story


