Market News
Week ahead: Shooting star on NIFTY50, Q4 earnings, WPI Inflation and F&O cues to watch this week
.png)
7 min read | Updated on April 15, 2024, 00:30 IST


SUMMARY
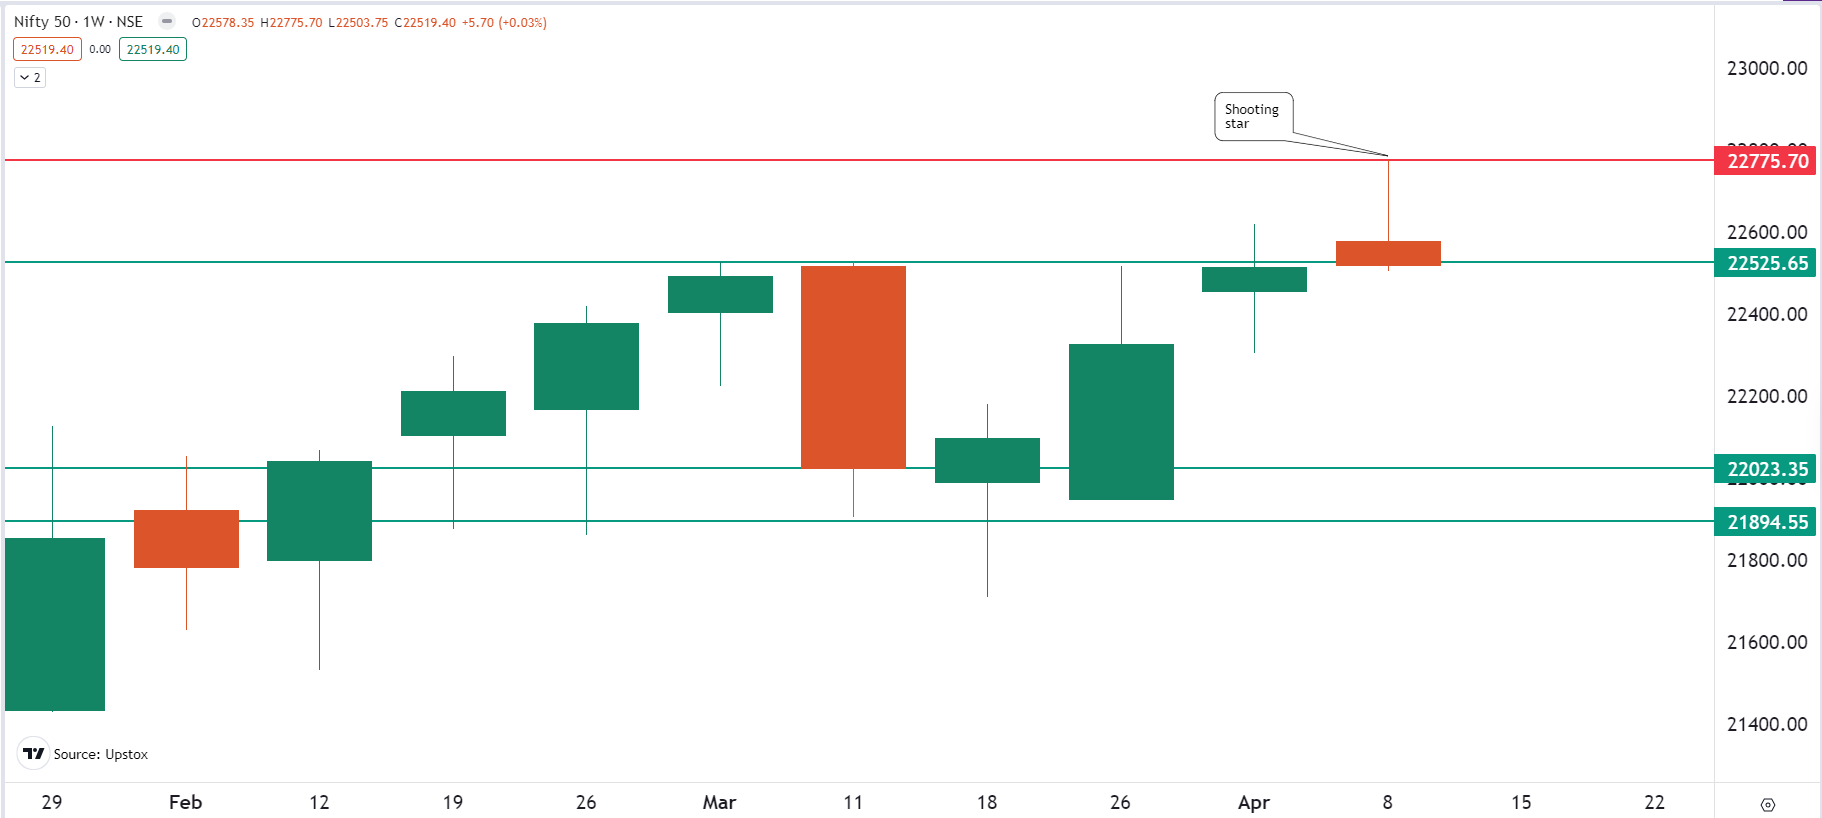
The NIFTY 50 index pared all its weekly gains on Friday and closed with a shooting star candlestick on the weekly chart. This signals a potential reversal of the recent upward movement. However, confirmation of the reversal pattern will depend on the close of this week’s candle. If it closes below the body of the shooting star, the bearish signal will be strengthened.

Weekly market outlook: Q4 earnings, WPI Inflation and F&O cues to watch this week
Markets gave up weekly gains to close flat on muted global cues and the signing of a tax treaty between India and Mauritius. This development paves the way for increased scrutiny of Foreign Portfolio Investors (FPIs). Although the NIFTY50 briefly regained its all-time high of 22,525 earlier in the week, it eventually gave up these gains to close the week almost flat at 22,519.
On Friday, investor sentiment was dampened by a number of factors. The U.S. Consumer Price Index (CPI) came in hotter-than expected and rose 0.4% on the month, signalling rising inflationary pressures. In addition, a surge in crude oil prices, coupled with a significant rise in the dollar index, further dampened investor sentiment.
The broader markets ended on a mixed note. The NIFTY Midcap 100 hit a fresh record high but closed flat on a weekly basis at 50,067, while the NIFTY Smallcap 100 index extended its gains for the third week in a row and closed at 16,496 (+0.8%).
Sectorally, both Metals and Realty extended their winning run for the fourth week in a row and advanced 2.9% and 1.5% respectively. Pharma and PSU Banks were the top losers and lost 1.9% and 1.4%.
Index breadth- NIFTY50
After spiking to 76% on the 10th, only 66% of the NIFTY50 stocks are currently trading above their 20-day moving average (DMA). Similarly, 60% of the NIFTY50 stocks are above their 50 DMA. A sharp drop in the breadth indicator was seen on Friday after the NIFTY50 fell below its previous three-day low.
In the coming week, the potential intersection of these two parameters, stocks trading above 20 and 50 DMAs (blue and green lines). It is important to note that the Breadth indicator tends to fluctuate between 50 and 70, indicating range-bound activity. However, if the blue line crosses below the green line, it will signal weakness in the ongoing momentum.

FIIs positioning in the index
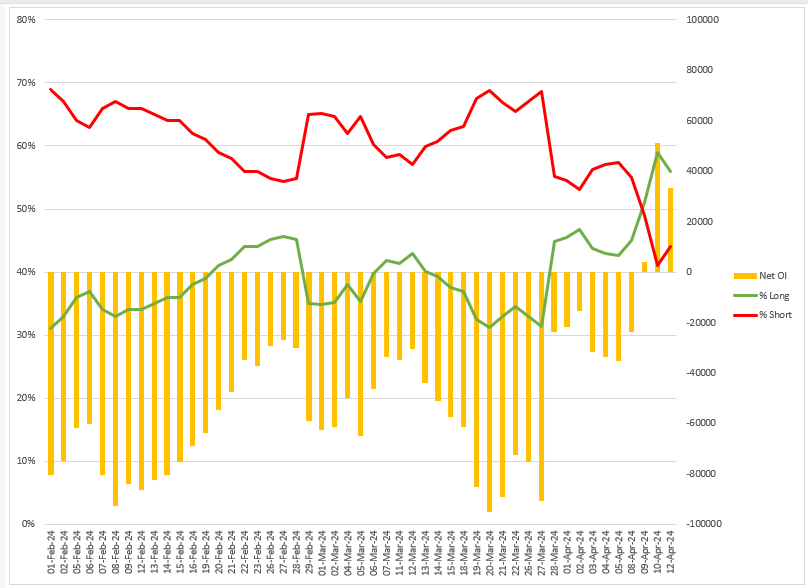
Foreign Institutional Investors (FIIs) reversed the long to short ratio in the index futures to 56:44 after a gap of almost three months. Currently, the net open interest (OI) of FIIs in the index futures stands at 33,448, indicating short-covering.
However, it is important to note that after the announcement of the Mauritius-India trade deal on Friday, there was a sharp fall of 35% in FII net OI in futures. Going forward, traders are advised to monitor the unwinding or addition in the ratio of long OI for a clear understanding of the developing trend.
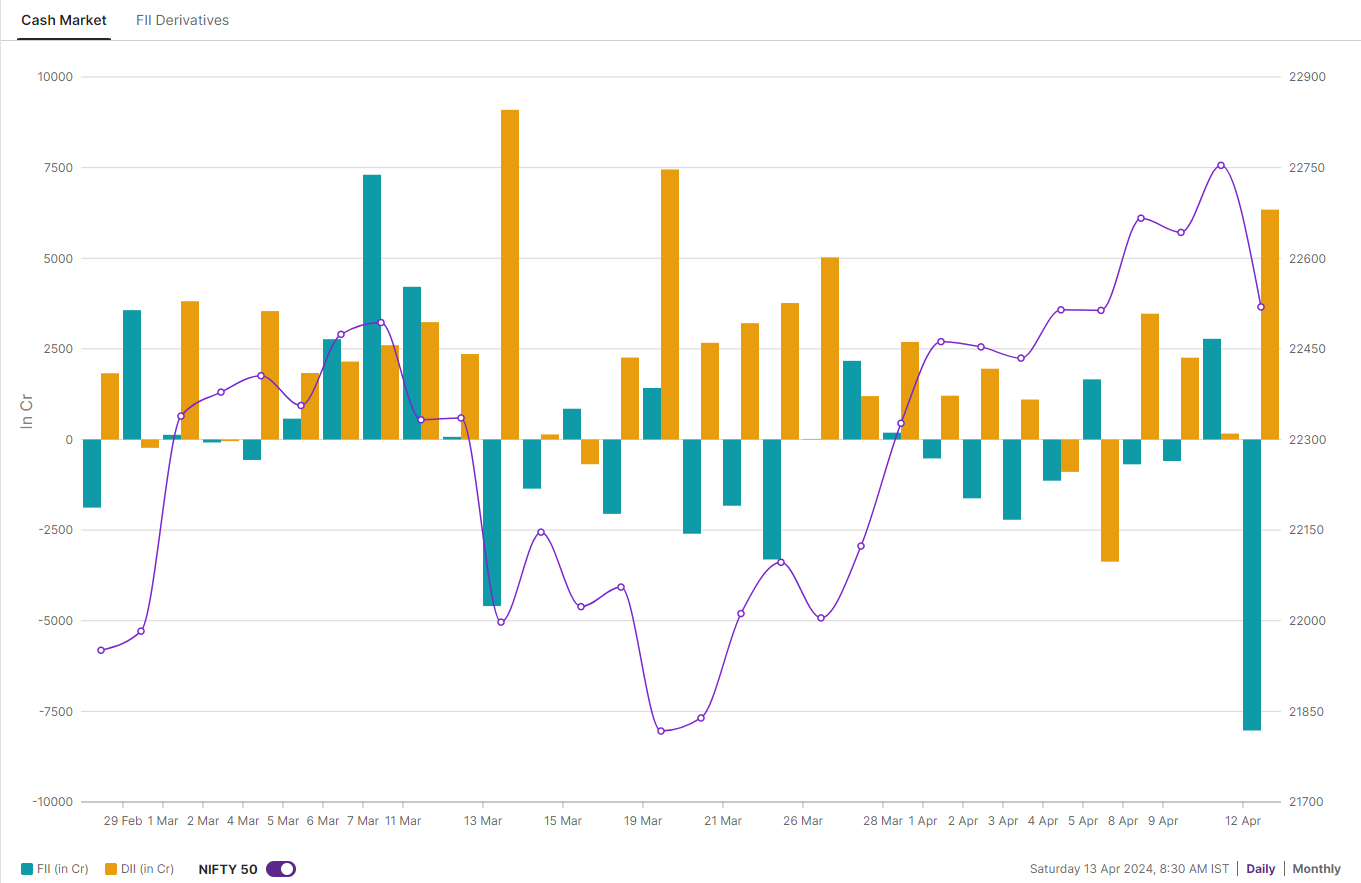
In the cash market, FIIs turned net sellers and sold equities worth ₹6,526 crore on a weekly basis. Conversely, flows from Domestic Institutional Investors (DIIs) absorbed the selling pressure and bought shares worth ₹12,232 crore. The net institutional flow for the week on a net basis was ₹5,706 crore.
F&O - NIFTY50 outlook
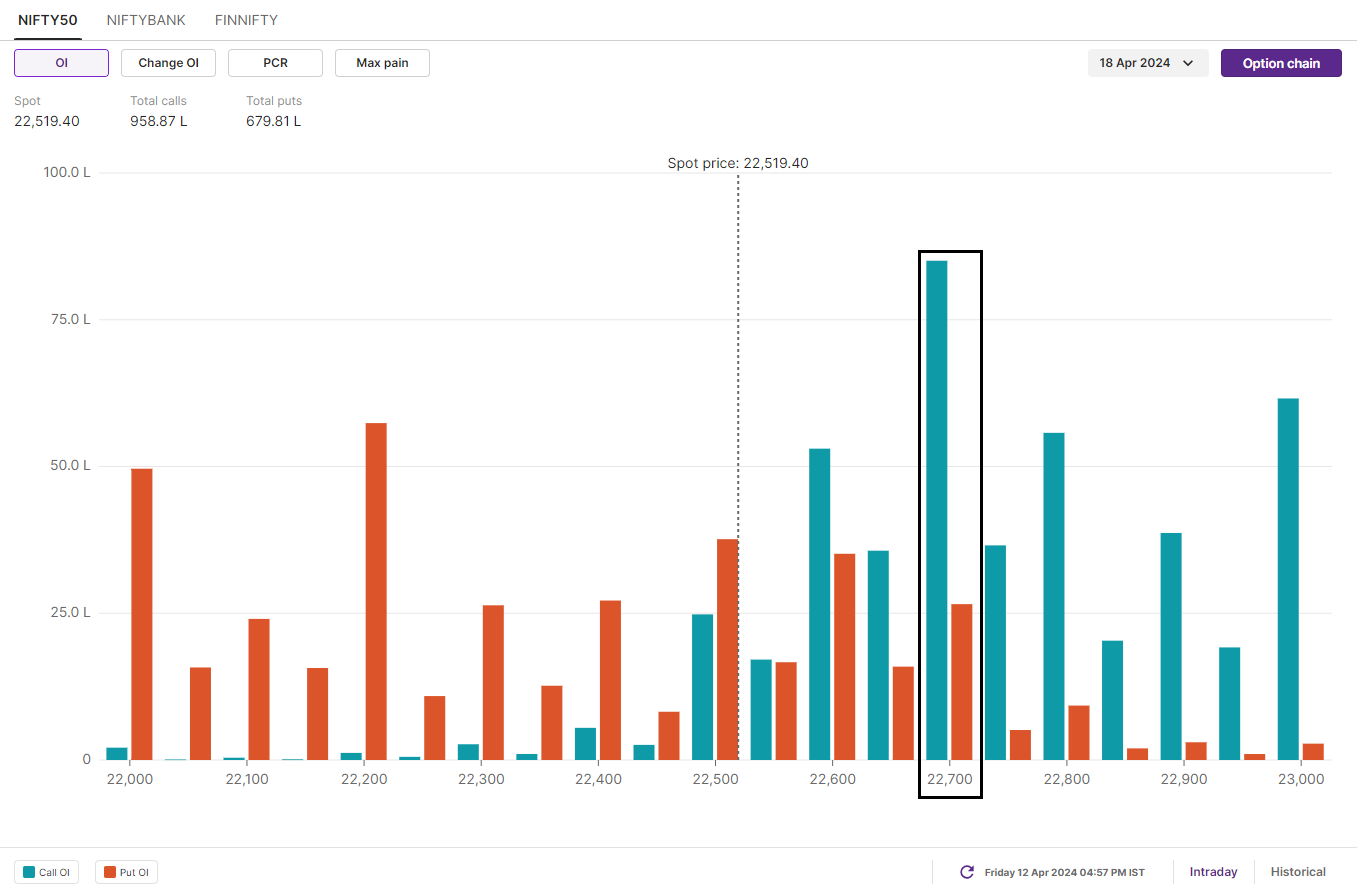
The initial open interest build-up for the April 18 expiry shows significant call OI at the 22,700 and 23,000 strikes, which should act as immediate resistance. On the other hand, put option OI build-up at the 22,200 and 22,000 strikes. Based on the initial accumulation, market participants expect the NIFTY50 to trade between 22,100 and 22,900.
The NIFTY 50 index pared its gains on Friday, reversing course with a bearish shooting star candlestick on the weekly chart. This pattern signals a potential reversal after an upward trend. The reversal will be confirmed if the next candlestick closes below the body of the shooting star.
The index also closed below its previous all-time high (22,525) for the week, adding to the bearish sentiment. With a holiday-shortened week and the start of the earnings season in both India and the US, volatility is likely to cause sharp swings. Immediate support for the NIFTY 50 lies between 22,150 and 22,200, which coincides with its key 50 DMA. Resistance remains at 23,000.
F&O - BANK NIFTY outlook
The open interest build-up for the 16 April expiry shows significant call OI at the 49,000 and 49,500 strikes. Conversely, there is significant put OI at the 48,000 and 48,500 strikes. Based on the initial OI build-up, market participants expect the BANK NIFTY to trade between 47,500 and 49,500.
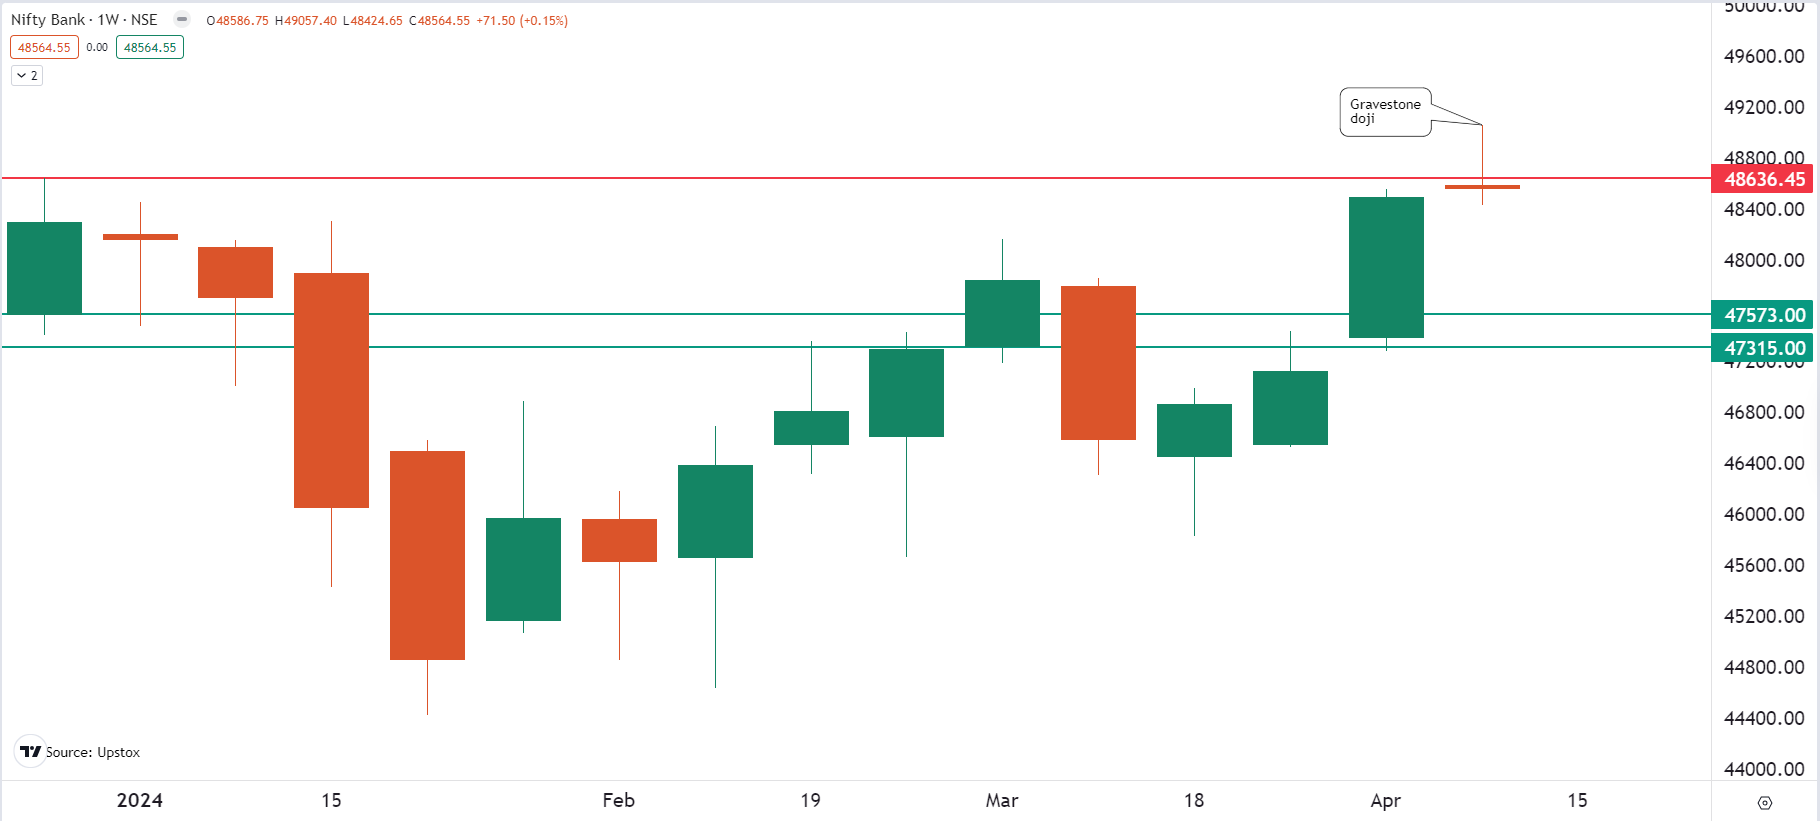
The BANK NIFTY crossed the all-time high (48,636) during the week and closed above it. However, the index came under selling pressure at higher levels on Friday, forming a gravestone doji on the weekly chart. A gravestone doji is also a bearish reversal pattern where the open, low and close are almost identical. However, the pattern is confirmed when the close of the next candle is lower than the reversal pattern.
In the truncated week, the immediate support for the BANK NIFTY is at 47,800 and the resistance remains at 49,000.
Traders should be cautious due to the potential reversal and the upcoming earnings season volatility. Earnings season can provide opportunities, but beware of sharp price swings
Confirmation of the bearish reversal depends on a close below 22,500-22,600. Meanwhile, immediate support for the NIFTY50 is at the 50-day moving average (22,150-22,200).
And we'll keep you updated on the changes and important developments via our morning trade setup blog, which is available every day before the market opens at 8 am.
About The Author
Next Story


