Trade setup for January 31: Expiry day test for BANK NIFTY
Upstox
4 min read • Updated: January 31, 2024, 9:04 AM
Summary
The banking index remains in a tug-of-war between key resistance at its 50 DMA (around 46,500) and support at its 200 DMA (around 44,700). Experts recommend watching the doji pattern, a neutral candlestick pattern where the opening and closing prices are almost identical. A decisive close above or below yesterday’s doji candle on the daily chart will provide critical clues.
_65816.png)
Asian markets update 7 am
Indian markets are set for a potentially flat or slightly negative start today, with the GIFTY NIFTY down 12 points. This mirrors the subdued sentiment in Asian markets, with Japan's Nikkei 225 falling 0.5% and Hong Kong's Hang Seng Index falling 0.2%.
U.S. market update
U.S. stocks closed mixed ahead of the Federal Reserve's latest interest rate decision and the start of big tech earnings. Shares of Alphabet (Google) fell around 6% in after-hours trading as the company reported lower-than-expected fourth-quarter advertising revenue. The tech-heavy Nasdaq Composite led the declines, falling 0.7% to 15,509. The Dow Jones was up 0.3% at 38,467 and the S&P 500 was flat at 4,924.
NIFTY50
February Futures: 21,630 (▼1.0%) Open Interest: 2,47,810 (▼9.1%)
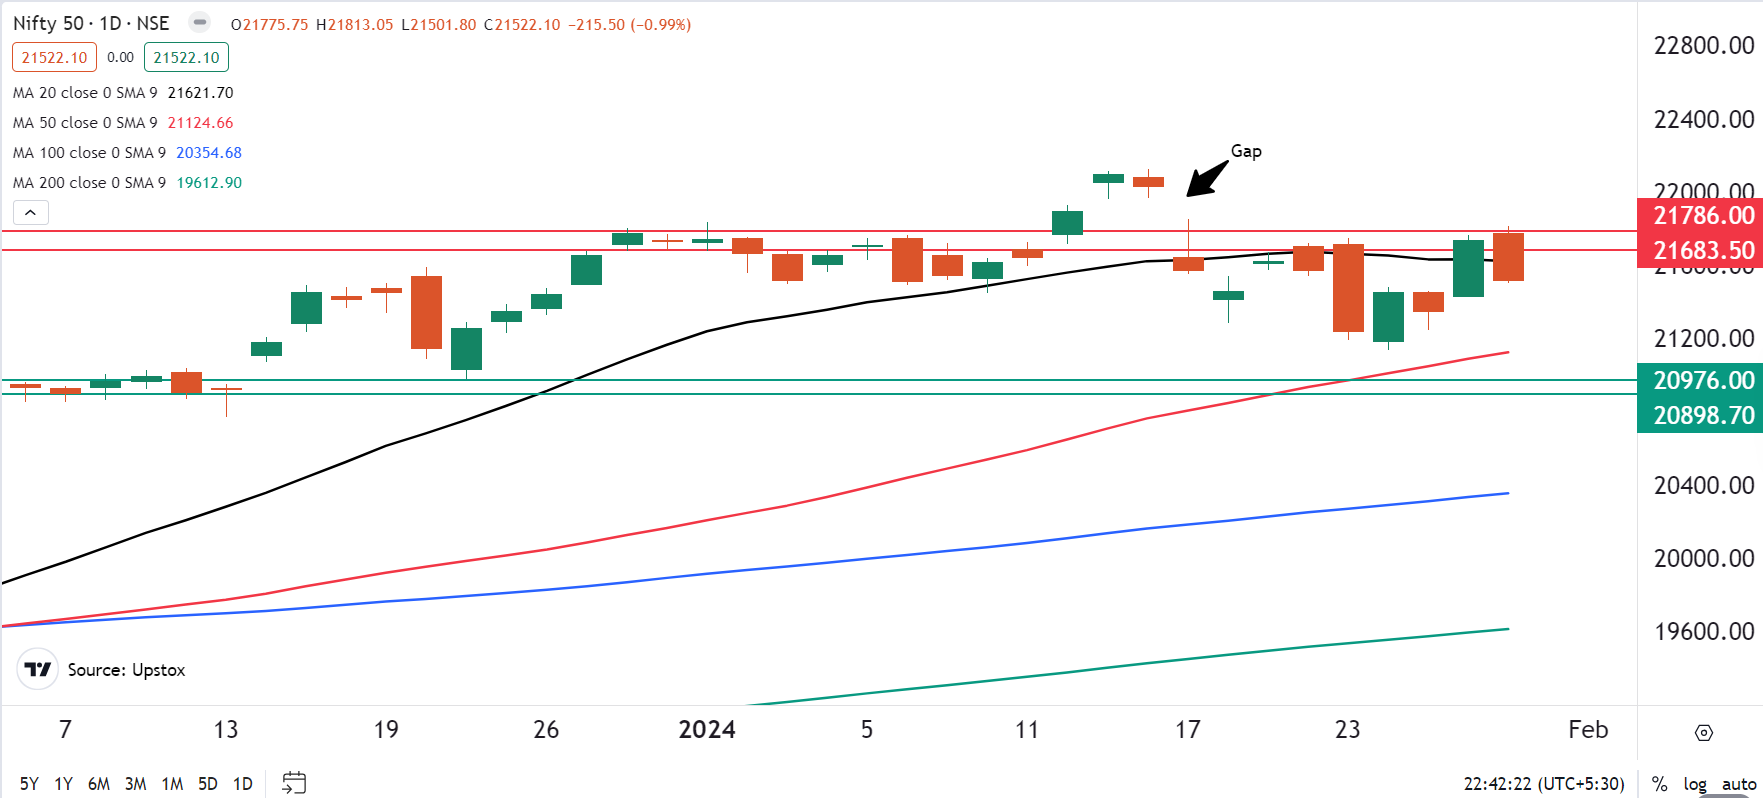
The NIFTY50 erased yesterday's gains, falling 1% on profit-booking ahead of the Union Budget and weak Q3 results. Apart from the Realty, which gained 0.9%, and Metal, which gained a modest 0.3%, all the major sectoral indices ended the day in the red. FMCG and Pharmaceuticals were the biggest losers, down 1.0% and 0.8% respectively.
Yesterday's "dark cloud cover" candlestick pattern on the NIFTY50 mirrors a bearish formation on the daily chart. As mentioned in our yesterday's blog, despite capturing the 20-day moving average (DMA), the bulls failed to break through the key 17 January high (21,850) for further momentum. This setback has pushed the index back between its 20 and 50 DMAs. Experts warn that a daily close below 21,500 could trigger a sharp decline, with the next key support at the 50 DMA.
Meanwhile, on the open interest front, the call option activity peaked at the 21,700 and 22,000 strikes. Put options were concentrated around the 21,000 and 21,500 strikes. For the February 1 expiry, traders expect the index to trade between 20,800 and 22,300.
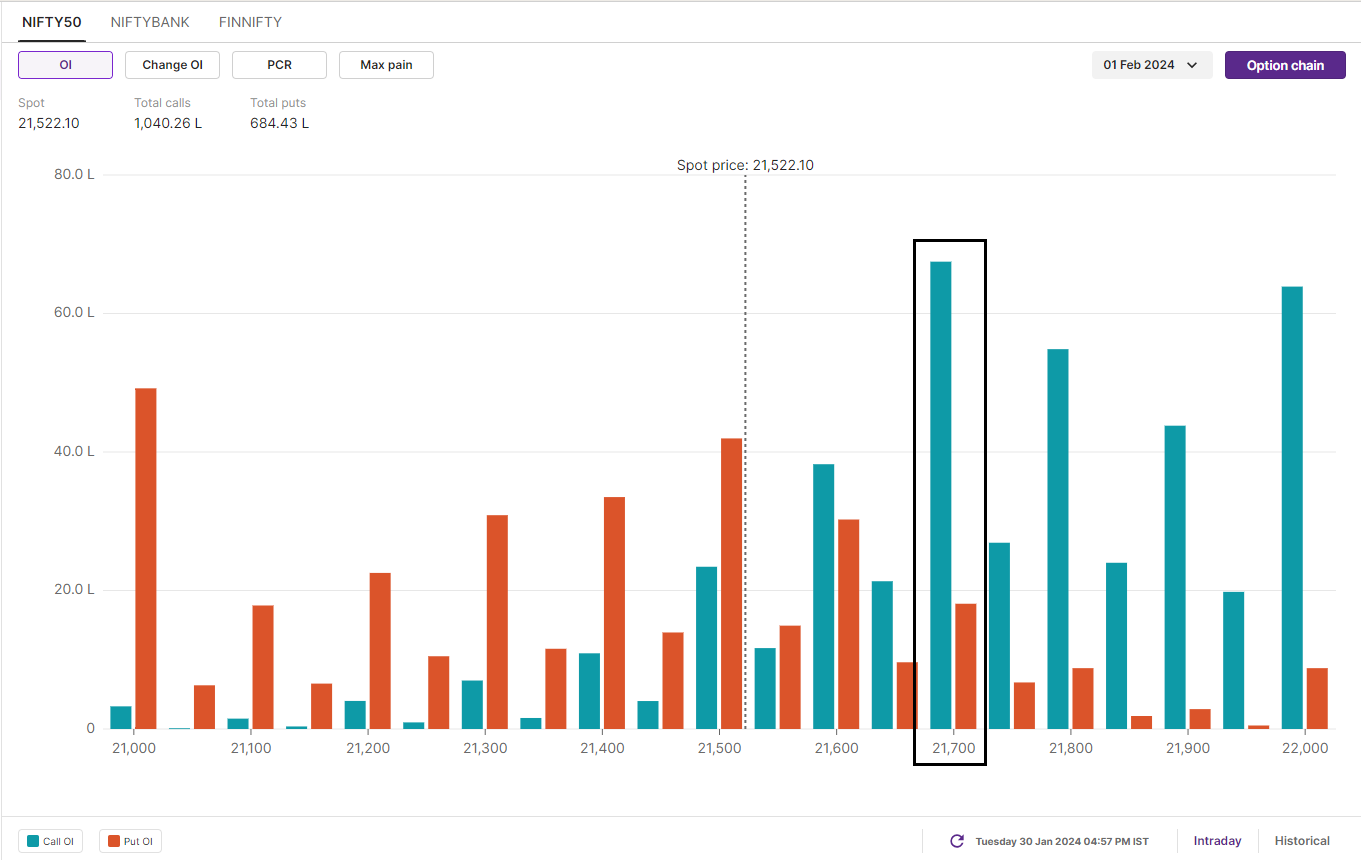
You can track open interest of the NIFTY50 here: https://pro.upstox.com/
BANK NIFTY
February Futures: 45,671(▼0.3%) Open Interest: 2,19,645 (▼0.3%)
The BANK NIFTY traded in a tight range with sharp bouts of intraday volatility. The index formed a doji candle on the daily chart after confirming yesterday's hammer pattern. However, the index slipped below its 100 DMA once again, closing almost flat (-0.1%).
The banking index remains in a tug-of-war between key resistance at its 50 DMA (around 46,500) and support at its 200 DMA (around 44,700). Experts recommend watching the doji pattern, a neutral candlestick pattern where the opening and closing prices are almost identical. A decisive close above or below the doji will provide critical clues.

Open interest in BANK NIFTY options for today's expiry shows a significant call base concentrated at the 46,000 and 45,500 strikes. Meanwhile, put options are concentrated around the 45,000 and 44,500 levels, providing some downside support. Based on this activity, traders expect the index to trade between 44,400 and 46,000.
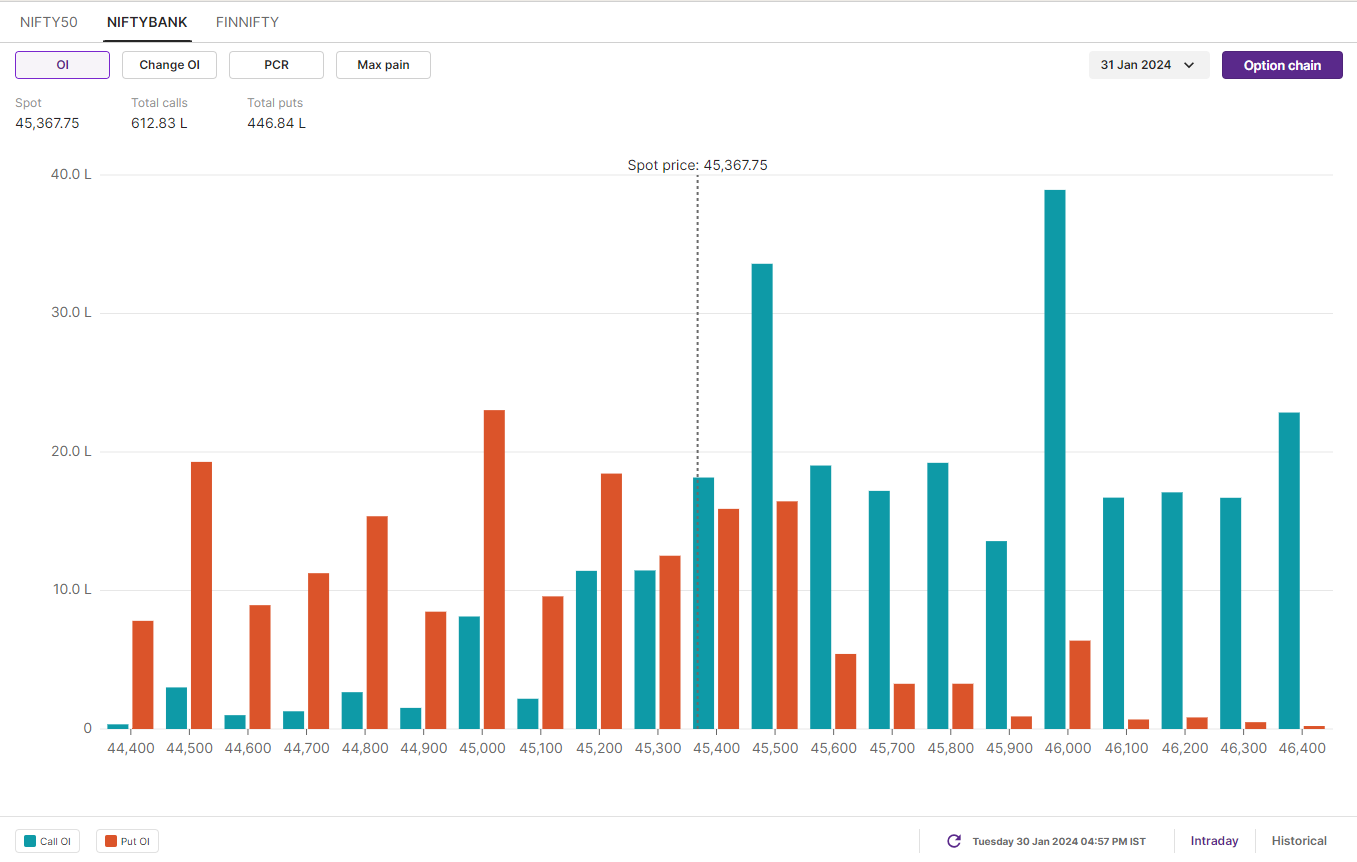
You can track open interest of the BANK NIFTY here: https://pro.upstox.com/
FII-DII activity
Foreign Institutional Investors (FIIs) offloaded a significant amount of shares in the cash market, selling ₹1,970 crore. This was countered by Domestic Institutional Investor (DIIs) who bought shares worth ₹1,002 crore. To track the ratio of long and short open positions of FIIs in the index, log in to https://pro.upstox.com/ ➡️F&O➡️FII-DII Activity➡️FII Derivatives.
Stock scanner
Long build-up: Bharat Petroleum, LIC Housing Finance, Jindal Steel & Power, Tata Motors and Indian Energy Exchange.
Short build-up: Coromandel International, Bajaj Finance, Chambal Fertilisers, Bajaj Finserv and ITC.
To access a specially curated smartlist of most traded and active stocks, as well as the OI gainers and losers, simply log in: https://pro.upstox.com/ ➡️F&O➡️Options smartlist/Futures smartlist
In Futures and Options or F&O, long build-up means an increase in Open Interest (OI) along with an increase in price, and short build-up means an increase in Open Interest(OI) along with a decrease in price.
Source: Upstox and NSE.
Disclaimer: Derivatives trading must be done only by traders who fully understand the risks associated with them and strictly apply risk mechanisms like stop-losses. The information is only for consumption by the client and such material should not be redistributed. We do not recommend any particular stock, securities and strategies for trading. The securities quoted are exemplary and are not recommendatory. The stock names mentioned in this article are purely for showing how to do analysis. Take your own decision before investing.