Market News
Trade setup for 28 March: Can NIFTY50 surpass the 20-DMA on expiry day?
.png)
4 min read | Updated on March 28, 2024, 09:00 IST


SUMMARY
Traders should also focus on the weekly close of both NIFTY50 and BANK NIFTY in this holiday-shortened week. Both the indices formed a bullish hammer pattern on the weekly chart last week, and as of today the price action suggests confirmation of the pattern. This signals a potential trend reversal, but the weekly close will provide more directional clues.
The GIFT NIFTY is trading flat, mirroring weak Asian peers
Asian markets update 7 am
The GIFT NIFTY is trading flat, mirroring weak Asian peers, suggesting a subdued start for the Indian equities today. Japan’s Nikkei 225 fell 1.2%, while the Hong Kong’s Hang Seng index slipped 0.2%.
U.S. market update
U.S. stocks snapped a three-day losing streak to end Wednesday's session higher on a broad-based rally across all sectors. The Dow Jones jumped 1.2% to close at 39,760, while the S&P 500 rose 0.8% to 5,248. The tech-heavy Nasdaq Composite gained 0.5% to close at 16,399.
NIFTY50
The NIFTY50 started Wednesday's session on a positive note and closed higher. The index traded above the previous day's high throughout the day and closed above it. However, the index again faced selling pressure around 22,200 and pared some of its gains towards the end of the session.
As you can see on the chart below, the index formed an inverted hammer pattern on the 26 March, which coincided with the key support of the 50-day moving average (DMA). An inverted hammer formation occurs after a downtrend and suggests a potential price reversal upon confirmation. On the 27 March, the index closed above the inverted hammer, confirming the pattern.
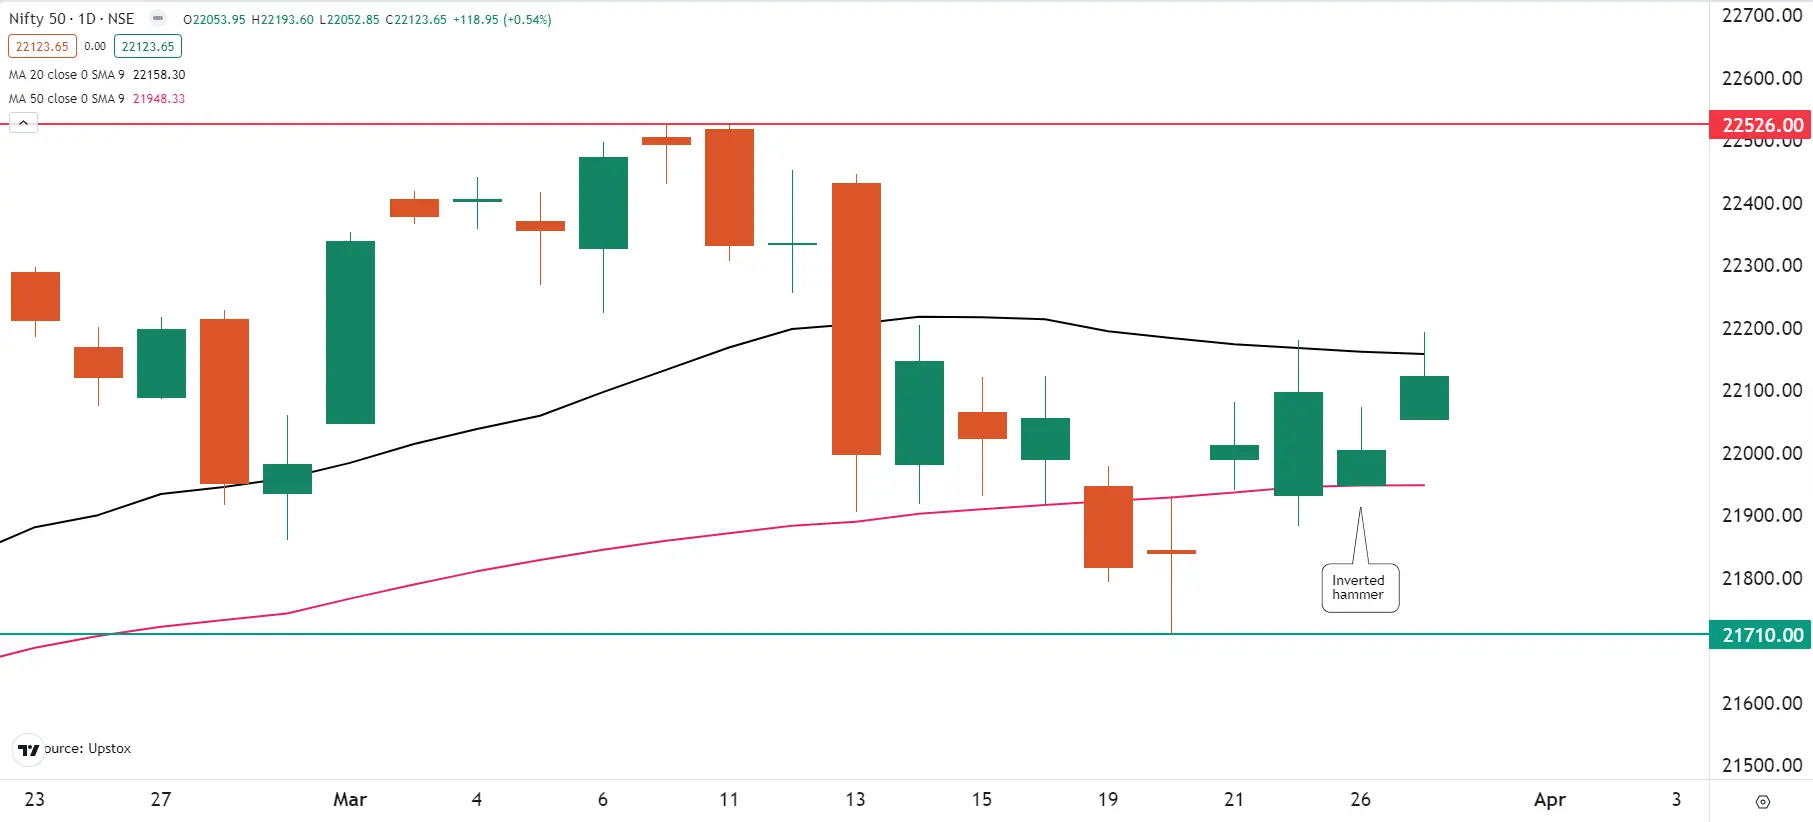
Currently, the NIFTY50 is consolidating at higher levels between its 20 and 50-day moving averages. According to experts, the index has immediate support at 21,950, aligning with its 50-DMA, and stronger support at 21,700. On the upside, the Immediate resistance sits at 22,200. To gauge the future direction, traders are advised to monitor the price action near 20 and 50 DMAs. A decisive break above or below this range will provide further directional clues.
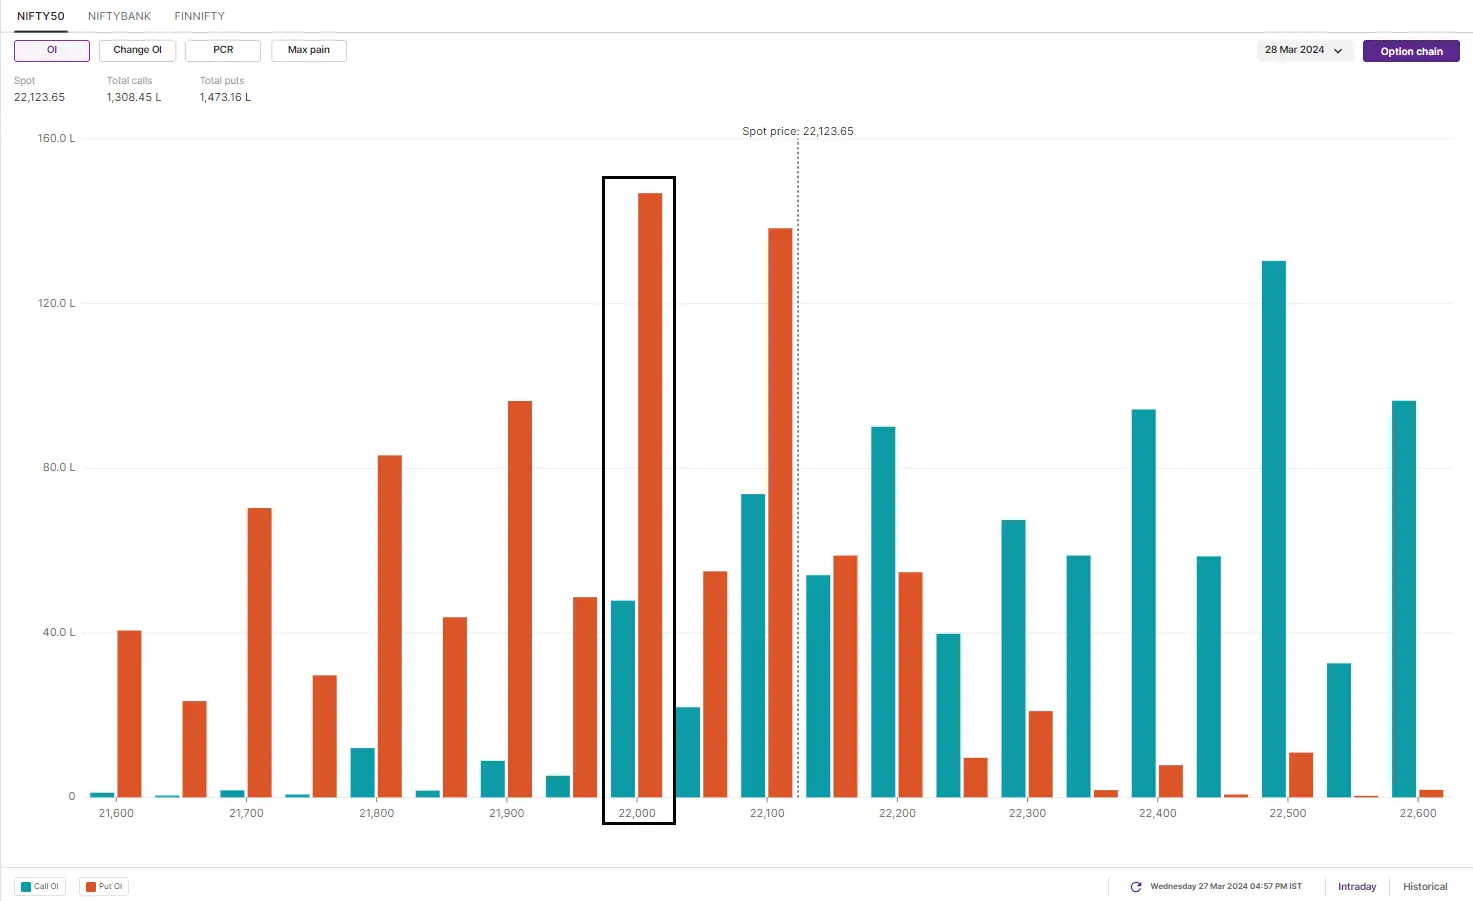
Open interest (OI) build-up for today’s expiry shows significant call base at 22,500 and 22,200 strikes. On the other hand, the base of put writers further strengthened at 22,000 and 22,100 strikes. Based on the options data, traders are expecting NIFTY50 to trade between 21,800 and 22,500.
BANK NIFTY
The BANK NIFTY extended its rangebound movement and ended Wednesday's session on a positive note. Despite the positive start, the index came under selling pressure around the 47,000 level, which is also in line with its 20 DMA.
Since 21 March, the BANK NIFTY has been trading sideways in a narrow range between 47,000 and 46,500. Like the NIFTY50, the BANK NIFTY is also stuck between its 20 and 50 DMAs. Notably, the BANK NIFTY also confirmed an inverted hammer on the 26 March, signalling a trend reversal.

Experts believe that the BANK NIFTY is consolidating around the 46,500 level, protecting the level on a closing basis for the last four sessions. They believe that traders should watch the 20 DMA near 47,000 as a rejection or close above this level could signal the index's next directional move.
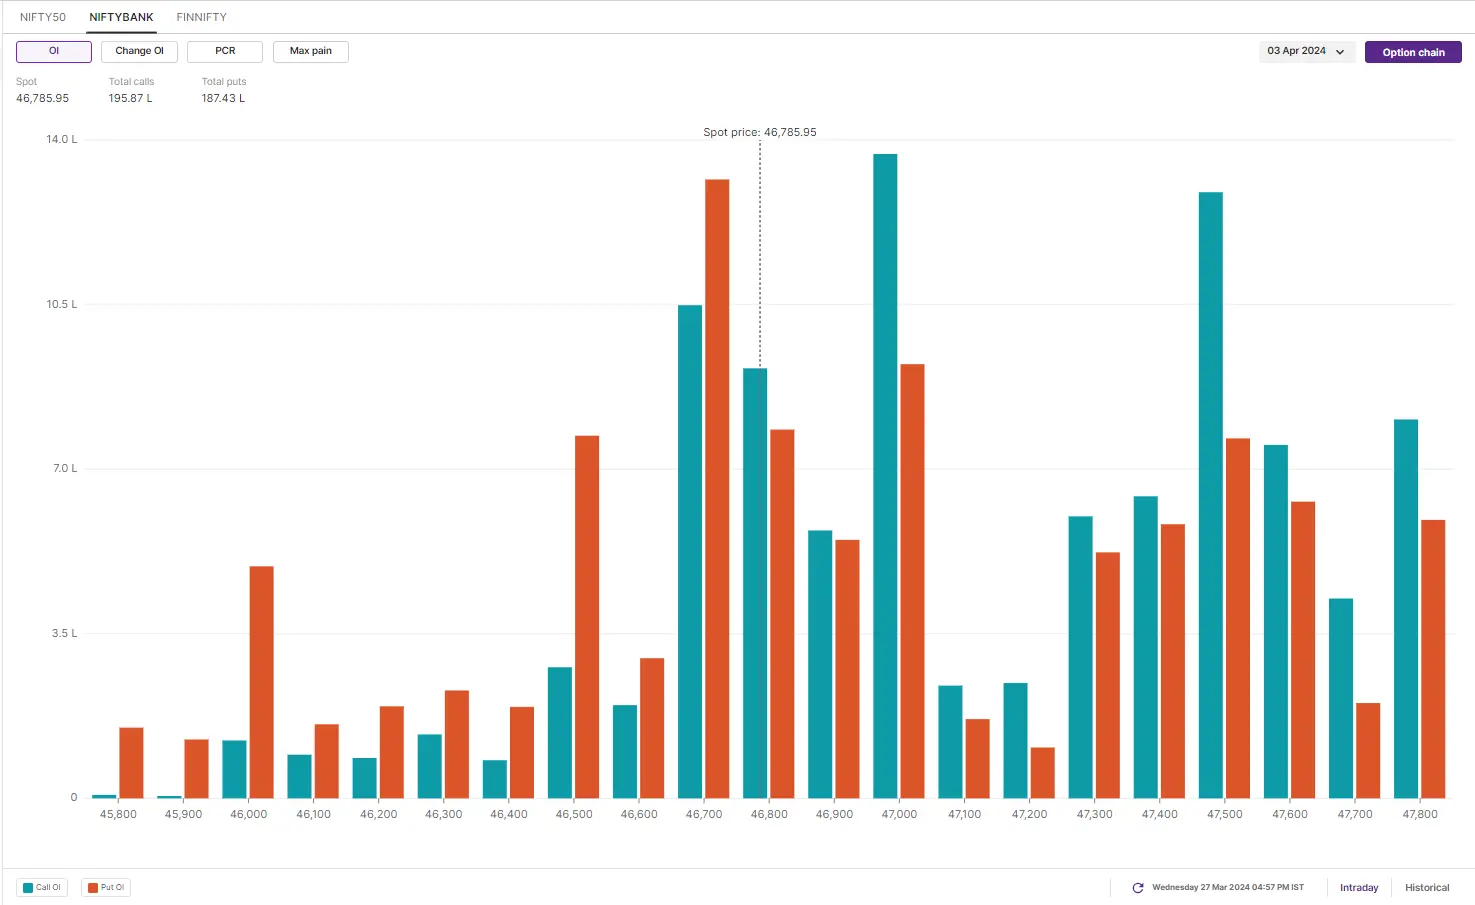
Initial open interest for the 3rd April BANK NIFTY expiry remains scattered, with a significant base at the 48,000 strike and a put base at the 46,700 strike. Based on the initial open interest, the traders are expecting BANK NIFTY to trade between 45,800 and 48,000.
FII-DII activity
Stock scanner
In Futures and Options or F&O, long build-up means an increase in Open Interest (OI) along with an increase in price, and short build-up means an increase in Open Interest(OI) along with a decrease in price.
About The Author
Next Story


