NIFTY50 to reverse bearish signal? Weekly chart holds the key
Upstox
5 min read • Updated: March 22, 2024, 8:19 AM
Summary
The NIFTY50 has staged a sharp recovery (over 1%) from the 21,700 level over the past two trading sessions. As of today, this rally is on the verge of negating the last week’s bearish engulfing pattern on the weekly timeframe. We advise our readers to closely monitor the weekly chart for confirmation or rejection of the bearish engulfing pattern today.

Asian markets update 7 am
The GIFT NIFTY is trading slightly lower (-0.1%), indicating a flat start for the NIFTY50 today. Meanwhile, Asian markets are trading mixed. Japan's Nikkei 225 is up 0.5% while Hong Kong's Hang Seng Index is down 0.9%.
U.S. market update
U.S. stocks ended slightly higher on Thursday as markets continued to digest the Fed Chairman’s message and the fact that three rate cuts remain part of the Fed’s 2024 outlook. The Dow Jones added 0.6% and ended the day at 39,781, while S&P 500 advanced 0.3% to close at 5,241. The tech-heavy Nasdaq Composite gained 0.2% and closed at 16,401.
NIFTY50
- March Futures: 22,102 (▲0.9%)
- Open Interest: 2,29,204 (▼2.1%)
After a gap-up start, the NIFTY50 consolidated in a range and reclaimed the 22,000 level on a closing basis. The U.S. Fed’s decision to keep the Fed Funds rate unchanged for the 5th consecutive time and to maintain the outlook for 3 rate cuts this year drove buying across sectors.
The NIFTY50 managed to hold onto its morning gains but came under selling pressure as it approached higher levels. However, the index showed resilience by reclaiming its 50-day moving average.
With the weekly expiry behind us, let's turn our attention to the weekly chart. Despite forming a bearish engulfing pattern last week (highlighted in our weekly blog), the NIFTY50 has staged a sharp recovery (over 1%) from the 21,700 level over the past two trading sessions. As of today, this rally is on the verge of negating the bearish engulfing pattern on the weekly timeframe.
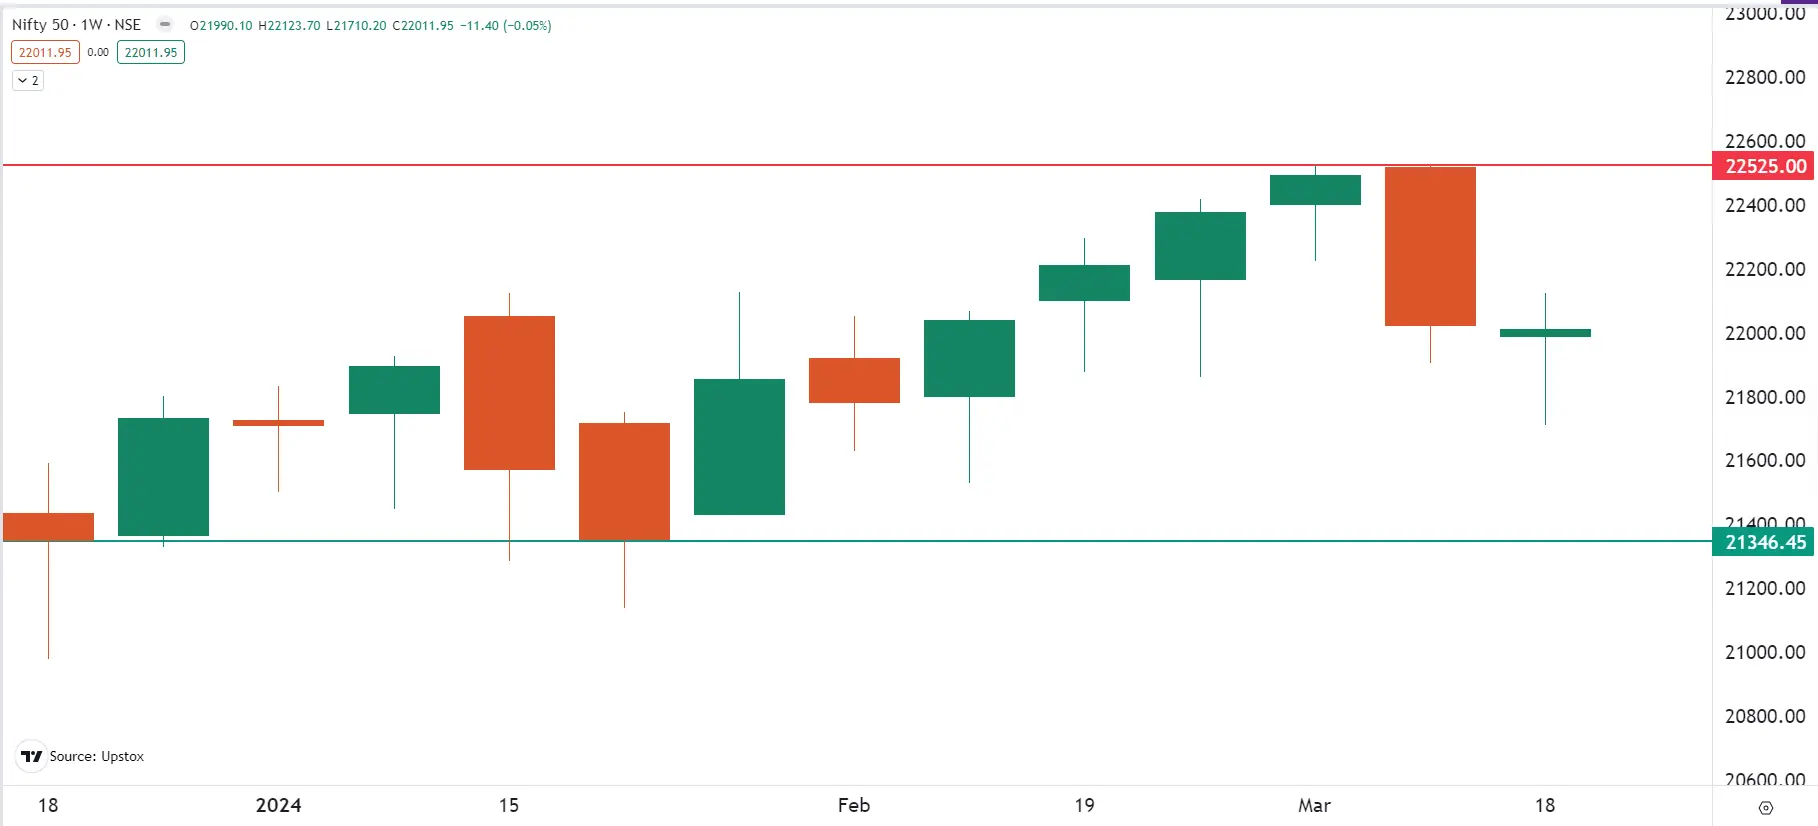
For a bearish engulfing pattern to be confirmed, the closing price of the next candle (current week) must be lower than the previous week’s close. We advise our readers to closely monitor the weekly chart for confirmation or rejection of the bearish engulfing pattern today. This will provide valuable clues as to the future direction of the market.
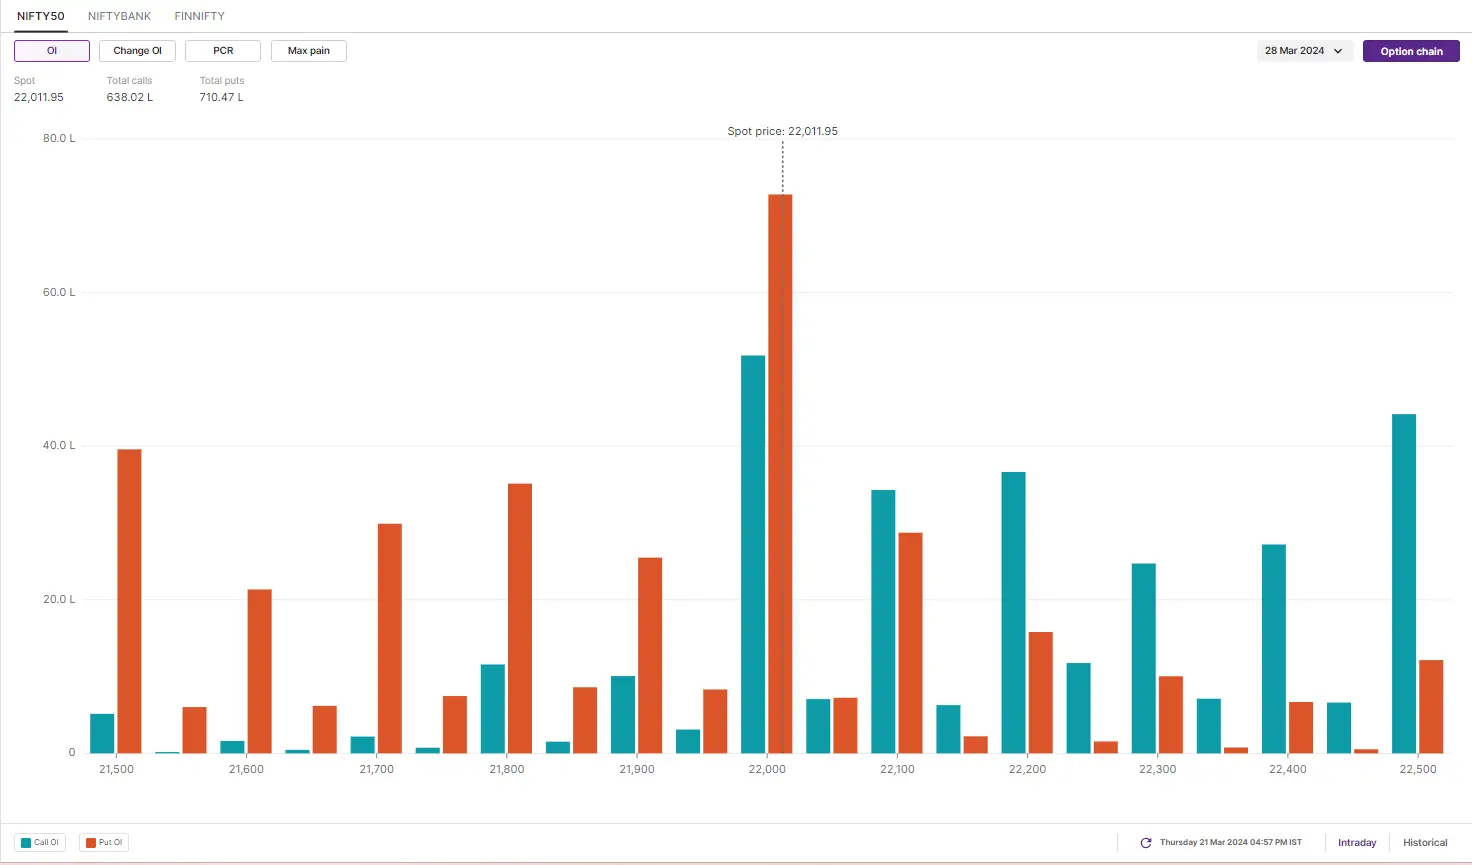
The initial open interest build-up for NIFTY50’s 28 March expiry shows a significant base at the 22,000 and 21,500 call option strikes and 22,000 and 22,500 put option strikes. Based on the initial build-up, traders are eyeing NIFTY’s trading range between 21,500 and 22,600.
BANK NIFTY
- March Futures: 46,794 (▲0.7%)
- Open Interest: 1,28,301 (▼1.1%)
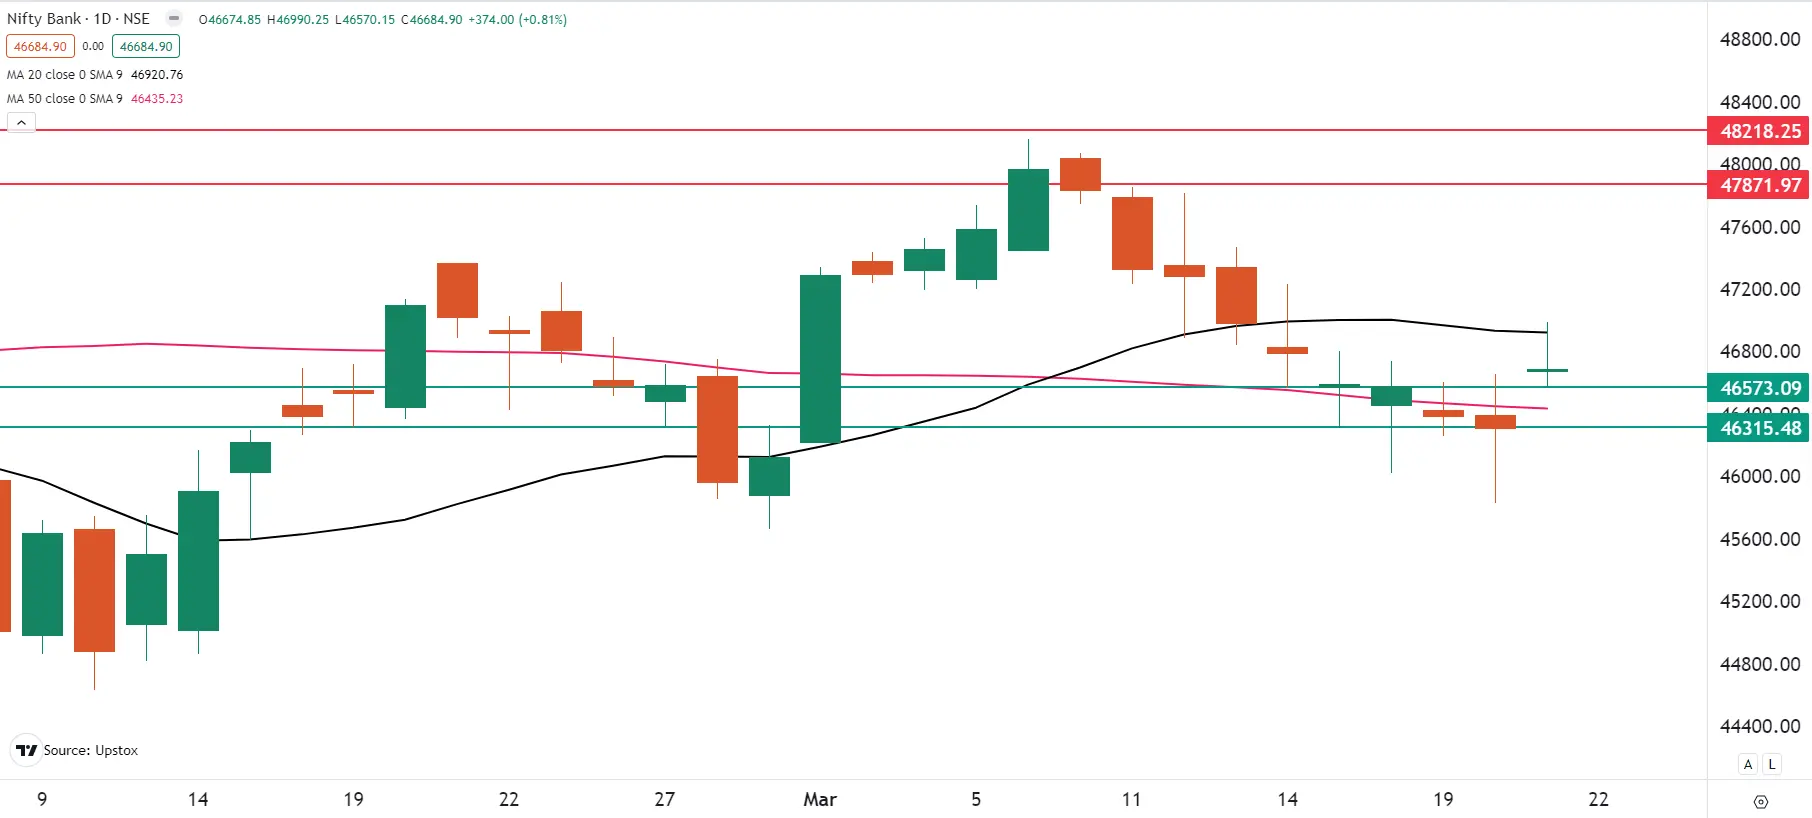
The BANK NIFTY finally snapped the nine-day losing streak on Thursday and closed above the 46,500 mark. However, once again a doji candle emerged on the daily chart, indicating ongoing indecision among investors.
Recall our yesterday’s blog where we highlighted the hammer pattern (18th March) and the crucial trading range of 46,700 (resistance) and 46,000 (support) for a potential breakout or breakdown. While the BANK NIFTY confirmed the hammer by closing above it, it ran into strong resistance at 47,000 and gave up all its intraday gains. This keeps the index still within the above mentioned range.
Experts believe that the BANK NIFTY has slipped back between its 20 and 50 day moving averages (DMA). The immediate resistance for the index is now at 47,000 mark, which coincides with the 20-DMA. Support remains at 46,000. Traders should closely monitor these levels for further clues.
Open interest (OI) build-up for 27 March Expiry shows significant call base at 47,000 and 48,000 strikes. On the other hand, the put writers have made base at 46,500 and 46,000 strikes. Based on the options data, traders are expecting BANK NIFTY to trade between 45,000 and 48,000 next week.

FII-DII activity
Foreign Institutional Investors (FIIs) sold shares worth ₹1,826 crore in the cash market, while the Domestic Institutional Investors (DIIs) bought shares worth ₹3,208 crore. To track the ratio of long and short open positions of FIIs in the index, log in to https://pro.upstox.com/ ➡️F&O➡️FII-DII Activity➡️FII Derivatives
Stock scanner
Long build-up: Steel Authority of India, SRF, Tata Steel, Muthoot Finance, REC and GMR Infra
Short build-up: Petronet LNG
Under F&O ban: Balrampur Chini Mills, Biocon, Indus Towers, Piramal Enterprises, Steel Authority of India, Tata Chemicals and Zee Entertainment
Out of F&O ban: Hindustan Copper and RBL Bank
To access a specially curated smartlist of most traded and active stocks, as well as the OI gainers and losers, simply log in: https://pro.upstox.com/ ➡️F&O➡️Options smartlist/Futures smartlist
In Futures and Options or F&O, long build-up means an increase in Open Interest (OI) along with an increase in price, and short build-up means an increase in Open Interest(OI) along with a decrease in price.
Source: Upstox and NSE.
Disclaimer: Derivatives trading must be done only by traders who fully understand the risks associated with them and strictly apply risk mechanisms like stop-losses. The information is only for consumption by the client and such material should not be redistributed. We do not recommend any particular stock, securities and strategies for trading. The securities quoted are exemplary and are not recommendatory. The stock names mentioned in this article are purely for showing how to do analysis. Take your own decision before investing.