Trade setup for 21 March: Doji on NIFTY50 chart ahead of expiry puts 21,800 in focus
Upstox
5 min read • Updated: March 21, 2024, 8:21 AM
Summary
According to the experts, the breadth of the NIFTY50 is weakening after falling below the major moving averages (20 and 50) and is running into resistance on the upside. For today's expiry, they see immediate resistance for the index at 22,100 and support at 21,700.

Asian markets update 7 am
After a positive handover from the Wall Street, the GIFT NIFTY is trading above the 22,000 mark, indicating a gap-up start for the NIFTY50 today. Asian markets are also trading in the green. The Nikkei 225 surged 1.3%, while the Hong Kong’s Hang Seng index gained 2.4%.
U.S. market update
U.S. markets climbed to new record highs after the Federal Reserve opted to kept the interest rate unchanged in the range of 5.25% to 5.5%. In a press conference, Fed Chairman Jerome Powell reassured that the plans for three rate cuts this year remain intact. The Dow Jones jumped 1% to close at 39,512, while the S&P 500 rose 0.8% to 5,224-its first ever close above 5,200-mark. The Nasdaq Composite zoomed 1.2% and ended the day at 16,369.
In there economic projections, inlduing the dot plot, which highlights the policymakers’ expectation for where the federal funds rate will be headed in the future. The Fed officials see the rate falling to 4.6% by the end of 2024. This suggests that the Fed will cut the rates by 0.75% this year.
NIFTY50
- March Futures: 21,910 (▲0.1%)
- Open Interest: 2,34,337 (▼1.8%)
The NIFTY50 ended the rangebound session marginally higher, but remained volatile throughout the session ahead of the outcome of the US Federal Reserve's interest rate decision and Fed Chairman's press conference.
The index formed a doji candle on the daily chart after closing below its 50-day moving average (DMA), highlighting investor indecision. According to the experts, the breadth of the NIFTY50 is weakening after slipping below the major moving averages (20 and 50), and is encountering resistance on the upside. For today's expiry, they see immediate resistance for the index at 22,100 and support at 21,700.

For today's expiry, the option chain shows a significant concentration of calls near the 22,200 and 22,200 strikes. Conversely, the put base is concentrated at the 21,500 and 21,800 strikes. Based on the positioning of the OI, traders expect the NIFTY50 to trade between 21,500 and 22,200.

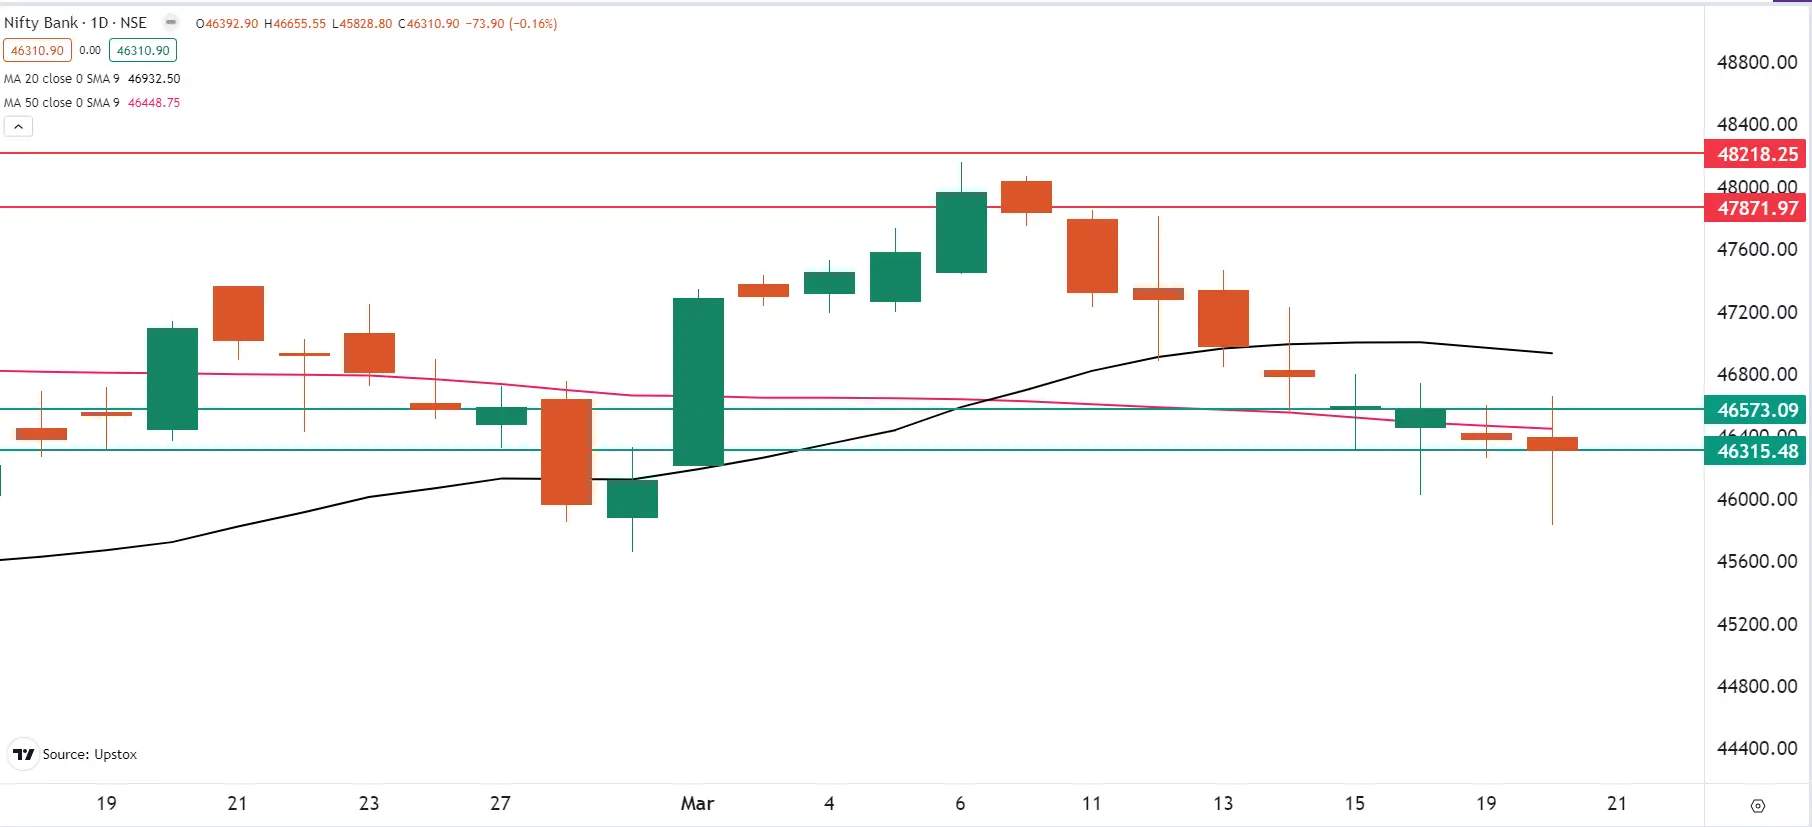
BANK NIFTY
- March Futures: 46,449 (▲0.03%)
- Open Interest: 1,29,802 (▲0.5%)
The BANK NIFTY extended its downward spiral for the ninth day and closed the volatile session flat. The index formed another doji candle on the daily chart, highlighting the ongoing indecision among investors. In the last nine days, the index has formed five doji candles on the daily chart.
In yesterday's analysis we identified two key observations. The daily chart on the 18th March showed a hammer candlestick, a potential bullish reversal pattern. We also highlighted a range on the hourly chart yesterday, defined by the high (46,700) and low (46,000) of the hammer. This area could provide further directional clues. Throughout the day, the index attempted to break above and below these levels, but ultimately closed within the range, failing to signal a decisive breakout in either direction. Traders are advised to closely watch price action around these key levels for directional clues.
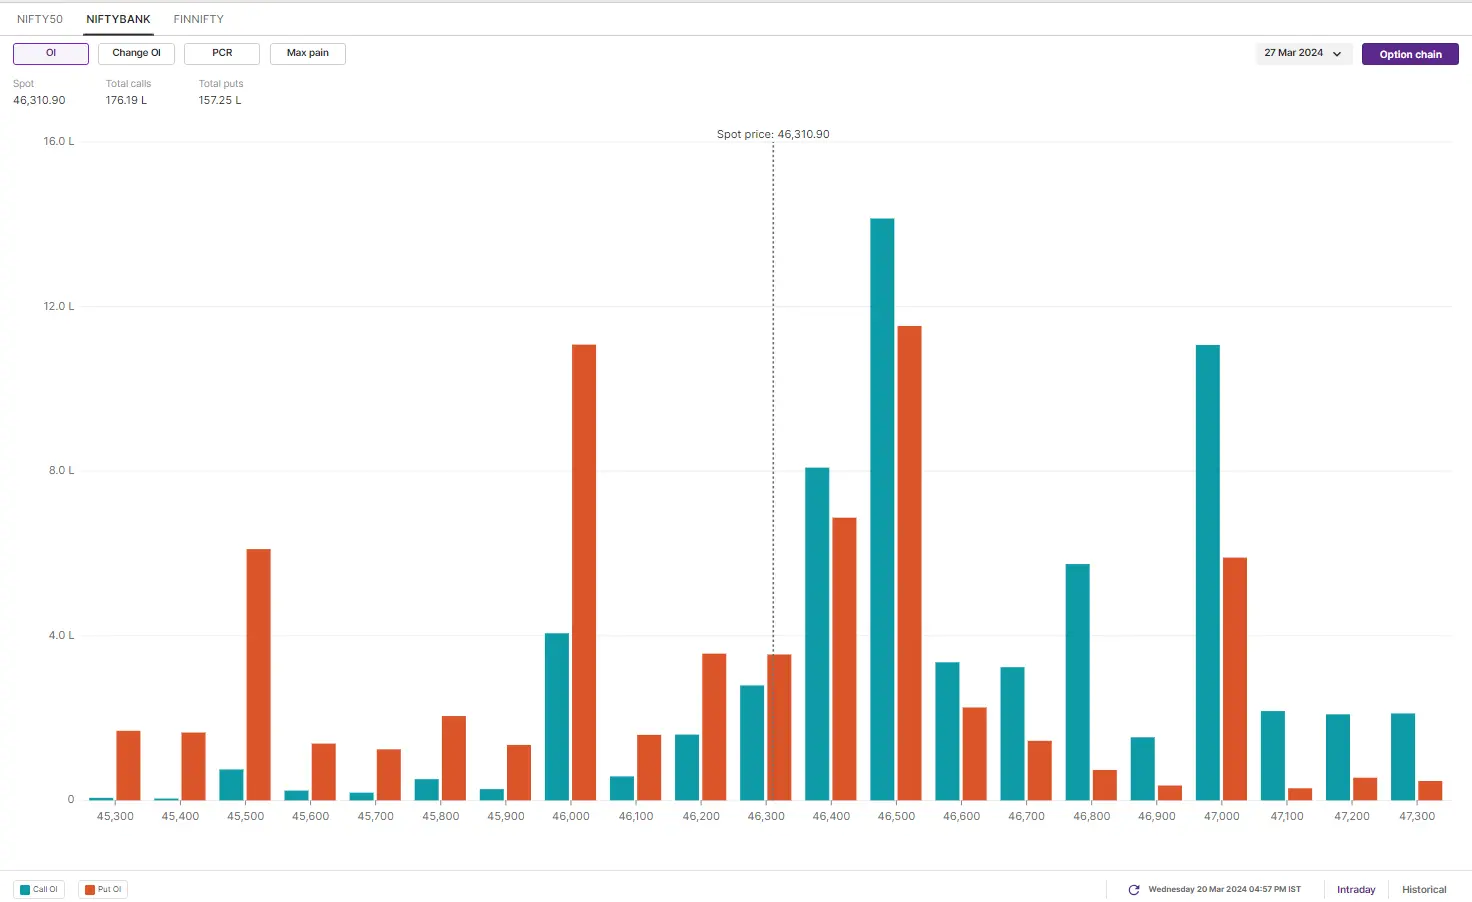
For BANK NIFTY's 27 March expiry, the initial open interest build-up shows a significant base at the 46,500 & 48,000 call option strikes and 46,500 & 46,000 put option strikes. Based on the initial build-up, traders are eyeing BANK NIFTY’s trading range between 48,000 and 44,800 for the 27 March expiry.
FII-DII activity
In the cash market, the Foreign Institutional Investors (FIIs) reamined net sellers and sold shares worth ₹2,599 crore, while the Domestic Institutional Investors (DIIs) purchased shares worth ₹2,667 crore. To track the ratio of long and short open positions of FIIs in the index, log in to https://pro.upstox.com/ ➡️F&O➡️FII-DII Activity➡️FII Derivatives
Stock scanner
Long build-up: Maruti Suzuki, Cummins India and Dr. Lal PathLabs
Short build-up: Tata Chemicals, Aditya Birla Fashion and Retail, Tata Steel and Laurus Labs
Under F&O ban: Tata Chemicals, Balrampur Chini Mills, Biocon, Hindustan Copper, Indus Towers, Piramal Enterprises, RBL Bank and Zee Entertainment
Out of F&O ban: BHEL and Steel Authority of India
To access a specially curated smartlist of most traded and active stocks, as well as the OI gainers and losers, simply log in: https://pro.upstox.com/ ➡️F&O➡️Options smartlist/Futures smartlist
In Futures and Options or F&O, long build-up means an increase in Open Interest (OI) along with an increase in price, and short build-up means an increase in Open Interest(OI) along with a decrease in price.
Source: Upstox and NSE.
Disclaimer: Derivatives trading must be done only by traders who fully understand the risks associated with them and strictly apply risk mechanisms like stop-losses. The information is only for consumption by the client and such material should not be redistributed. We do not recommend any particular stock, securities and strategies for trading. The securities quoted are exemplary and are not recommendatory. The stock names mentioned in this article are purely for showing how to do analysis. Take your own decision before investing.