Trade setup for 18 March: Will the support hold? NIFTY50 and BANK NIFTY test key levels
Upstox
5 min read • Updated: March 18, 2024, 7:53 AM
Summary
The NIFTY50 is trading near the crucial support zone of 50-DMA and swing low of 21,860, which has earlier acted as a crucial support. Traders are advised to closely watch the price action near these crucial support levels for further directional clues. On the other hand, the immediate resistance remains at 22,250.

Asian markets update 7 am
The GIFT NIFTY trades 0.1% lower, indicating a flat to negative start for Indian equities today. Asian markets are trading mixed. Japan's Nikkei 225 is up more than 2%, while Hong Kong's Hang Seng Index is down 0.2%.
U.S. market update
U.S. markets closed lower on Friday amid a sell-off in technology stocks on the triple witching day. This is the day when derivative contracts on stocks, index options and futures expire all on the same day. The Dow Jones Industrial Average closed 0.4% lower at 38,174, while the S&P 500 slipped 0.6% to 5,117. The tech-heavy Nasdaq 100 was down 0.9% at 15,973.
NIFTY50
- March Futures: 22,133 (▼0.6%)
- Open Interest: 2,51,057 (▼2.7%)
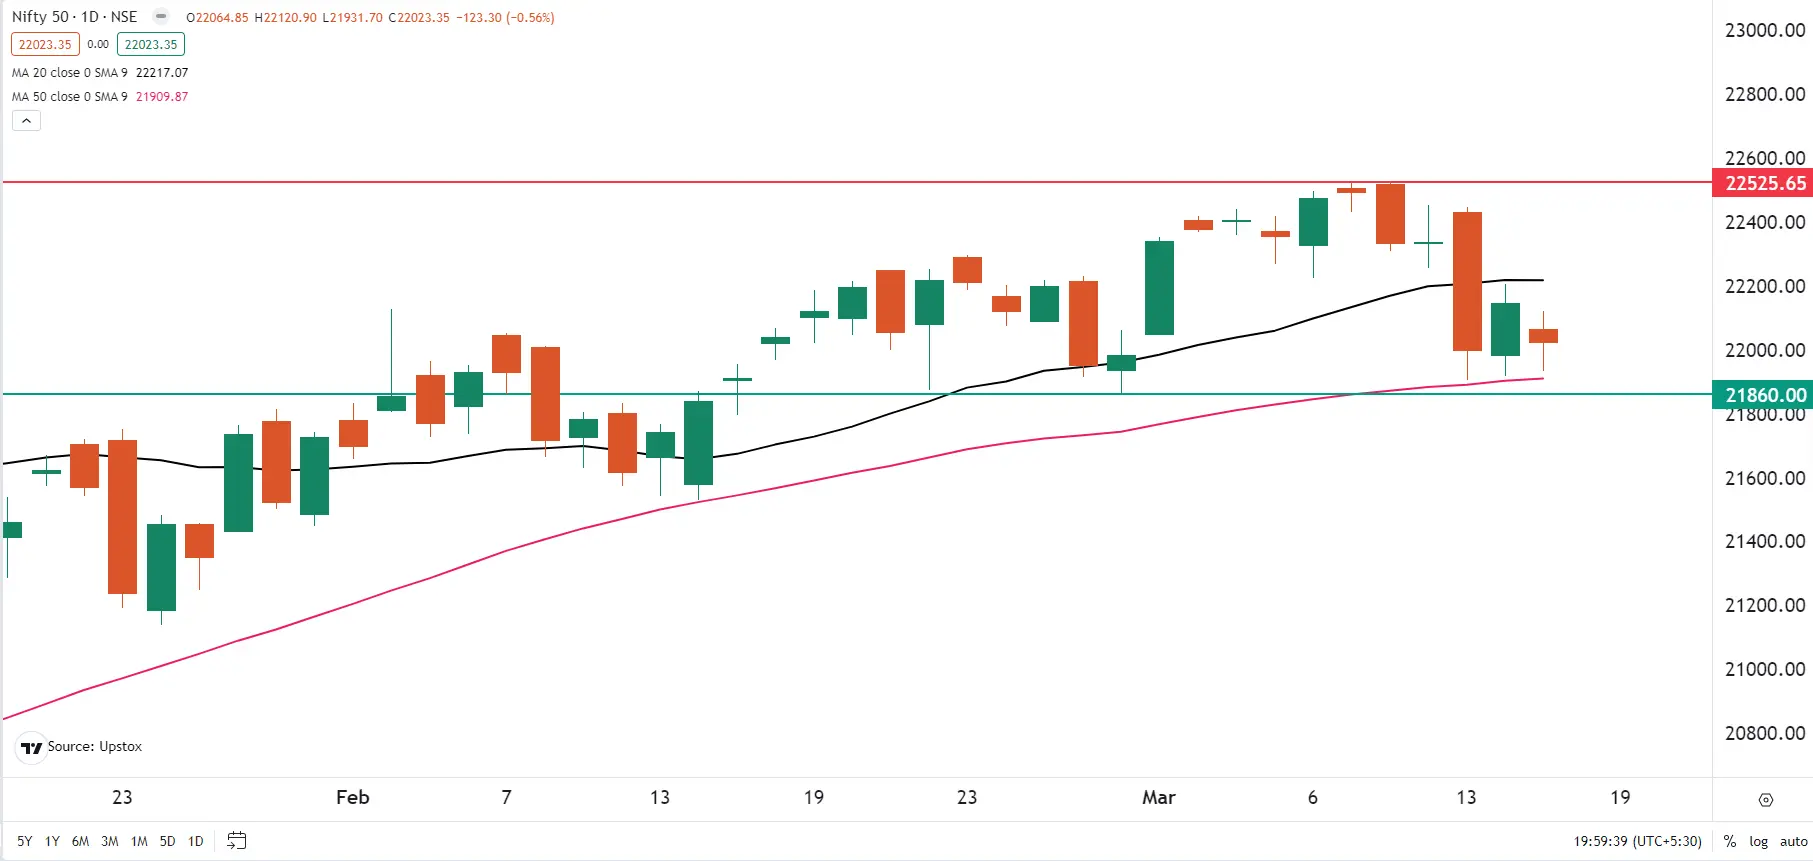
After a day’s relief, the NIFTY50 closed in the red on Friday and formed an inside bar candle on the daily chart. The NIFTY50 erased all Thursday’s gains and traded near the day’s low for the major part of the day, due to broad-based selling in all the major sectors.
As you can see in the chart below, NIFTY50 is trading near the crucial support zone of 50-DMA and swing low of 21,860, which has earlier acted as a crucial support. We highlighted in our previous blog that in the past the sharp falls of over 1% on the previous two occasions since January have failed to provide the follow through of the trend. Going forward, if the index closes below 50-DMA and swing low of 21,860, then the trend on the daily time frame will change from higher-highs and higher-lows.
Traders are advised to closely watch the price action near these crucial support levels for further directional clues. On the other hand, the immediate resistance remains at 22,250.
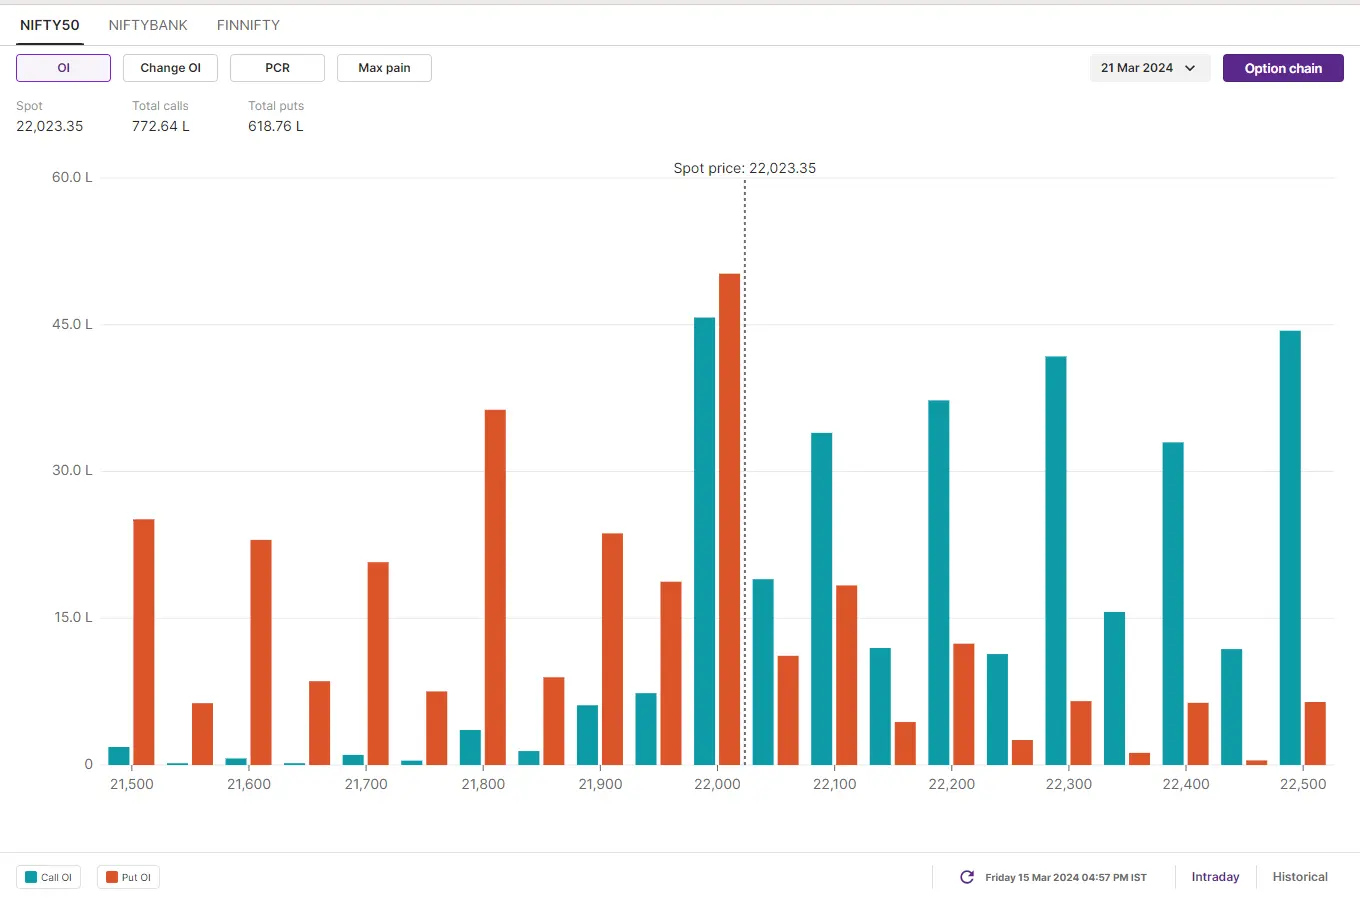
The open interest build-up for the 21 March expiry shows a significant call base at the 22,000 and 22,500 strikes. Conversely, the put base is established at the 22,000 and 21,800 strikes. As per the initial build-up, the NIFTY50 is expected to trade between 21,500 and 22,600 this week.
BANK NIFTY
- March Futures: 46,694 (▼0.6%)
- Open Interest: 1,30,747 (▼0.2%)
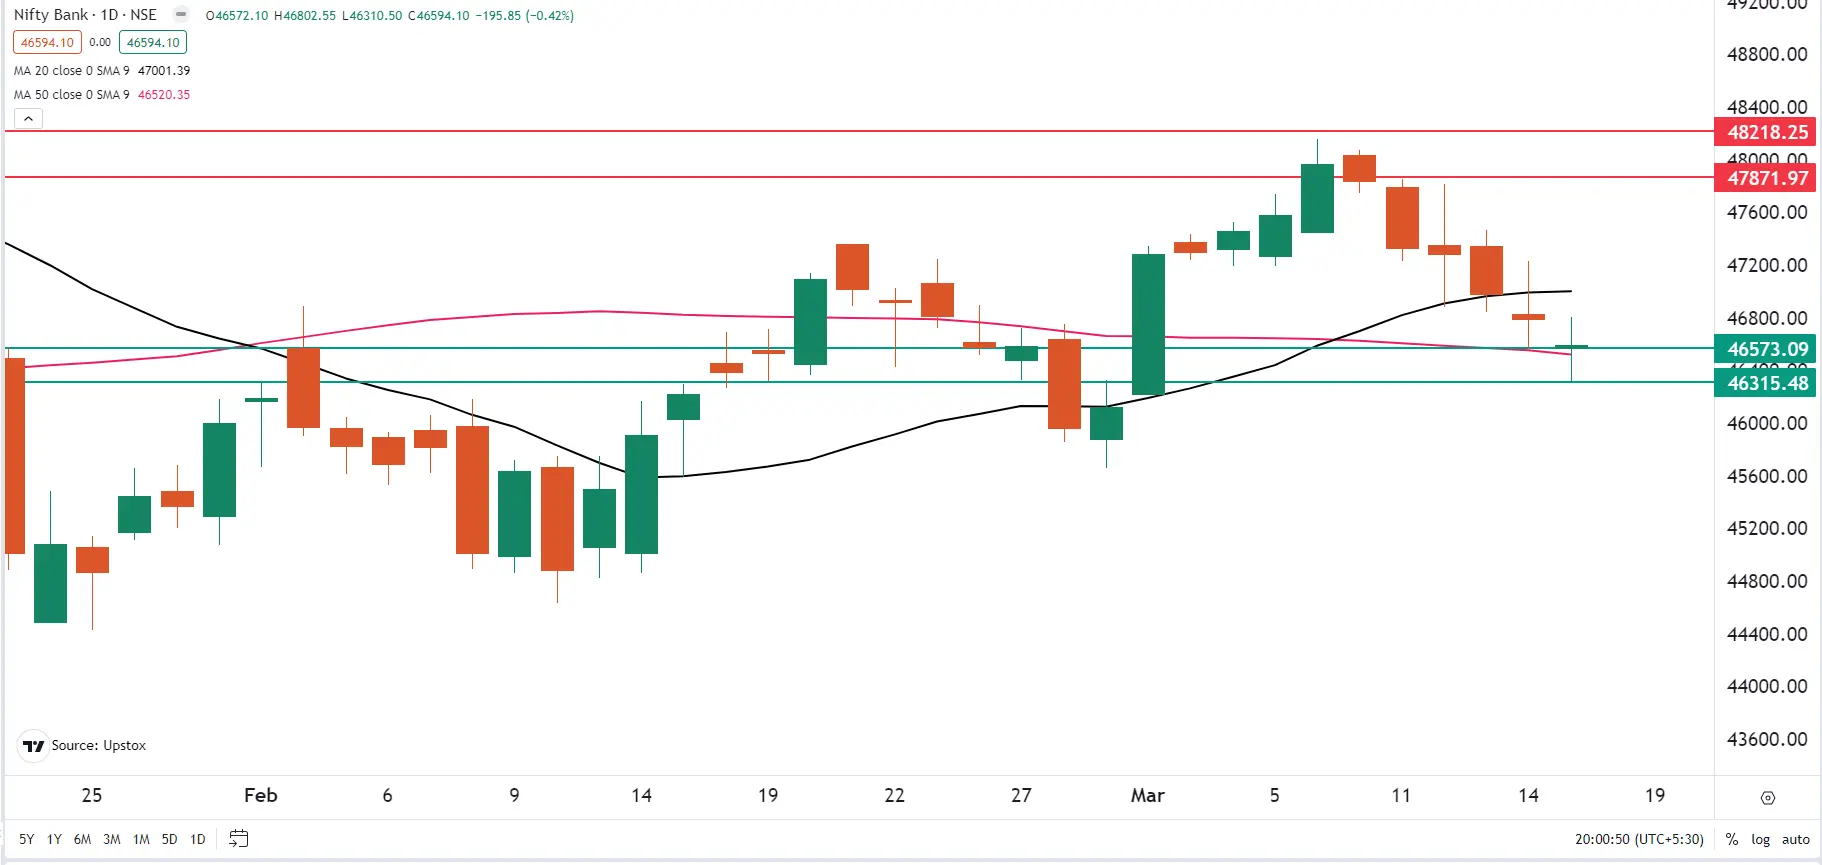
The BANK NIFTY extended its losing streak for the sixth day in a row and formed yet another doji candle on Friday. This is the third doji formation on the daily chart in the previous four trading sessions, highlighting indecision among traders.
As you can see in the chart below, the index took support near the 46,300 level and protected its 50-DMA on the closing basis. Similar to the NIFTY50, the BANK NIFTY is also stuck between its 20 and 50-DMAs. It has immediate support at its 50-DMA (around 46,500) and resistance at 47,200. A decisive break and close below this range will provide further directional clues to the traders.
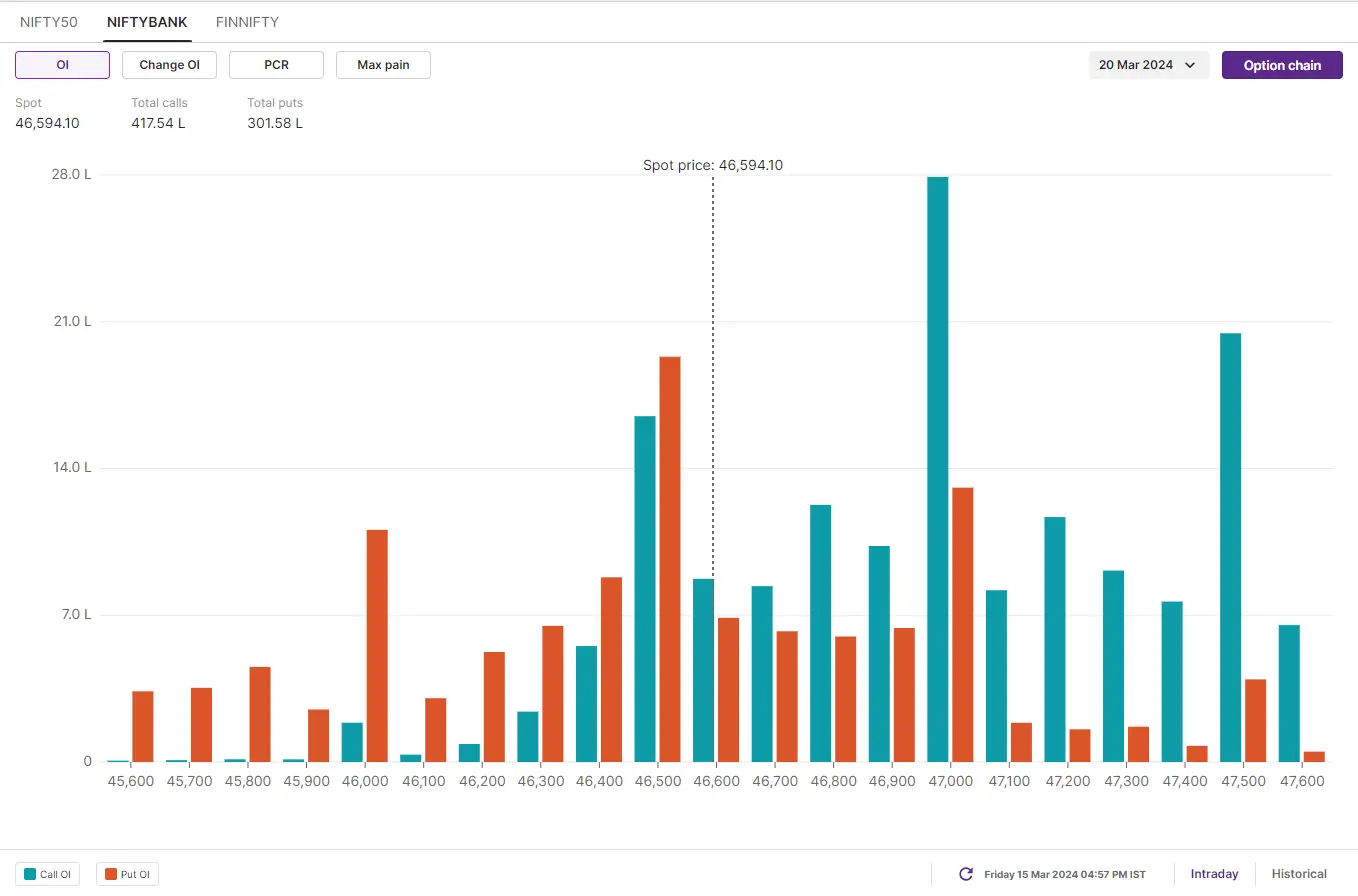
For BANK NIFTY's 20 March expiry, the open interest build-up shows a significant base at the 47,000 & 48,000 call option strikes and 46,500 & 45,500 put option strikes. Based on the initial build-up, traders are eyeing BANK NIFTY’s trading range between 48,000 and 44,800 for the 20 March expiry.
FII-DII activity
The Foreign Institutional Investors (FIIs) turned net buyers in the cash market and bought shares worth ₹848 crore on Friday. On the contrary, the Domestic Institutional Investors (DIIs) sold shares worth ₹682 crore. To track the ratio of long and short open positions of FIIs in the index, log in to https://pro.upstox.com/ ➡️F&O➡️FII-DII Activity➡️FII Derivatives
Stock scanner
- Long build-up: Hindustan Copper, Page Industries and Ambuja Cements
- Short build-up: Hindustan Petroleum, Biocon, Power Finance Corporation and Mahindra And Mahindra
- Under F&O Ban: Aditya Birla Fashion and Retail, BHEL, Biocon, Hindustan Copper, Manappuram Finance, National Aluminium, Piramal Enterprises, RBL Bank, Steel Authority of India, Tata Chemicals, Zee Entertainment
Catch up on Friday’s trading insights from NIFTY 200! Don't miss our market recap blog, offering valuable insights in a concise format. Click here to read and stay informed
To access a specially curated smartlist of most traded and active stocks, as well as the OI gainers and losers, simply log in: https://pro.upstox.com/ ➡️F&O➡️Options smartlist/Futures smartlist
In Futures and Options or F&O, long build-up means an increase in Open Interest (OI) along with an increase in price, and short build-up means an increase in Open Interest(OI) along with a decrease in price.
Source: Upstox and NSE.
Disclaimer: Derivatives trading must be done only by traders who fully understand the risks associated with them and strictly apply risk mechanisms like stop-losses. The information is only for consumption by the client and such material should not be redistributed. We do not recommend any particular stock, securities and strategies for trading. The securities quoted are exemplary and are not recommendatory. The stock names mentioned in this article are purely for showing how to do analysis. Take your own decision before investing.