Trade setup for 10 April: NIFTY50 and BANK NIFTY key support and resistance levels for expiry
Upstox
4 min read • Updated: April 10, 2024, 8:24 AM
Summary
The BANK NIFTY has formed the second back-to-back doji on the daily chart, highlighting the range-bound activity following the positive start. As the doji is a neutral candlestick pattern, a break of the high and low of this candle (9 April) will provide traders more directional insights.

Asian markets update 7 am
The GIFT NIFTY is up 0.2%, indicating a positive start for Indian equities today. Meanwhile, Asian markets are trading mixed. Japan's Nikkei 225 is down 0.4%, while Hong Kong's Hang Seng Index is up 0.6%.
U.S. market update
U.S. stocks ended a choppy session flat ahead of the release of the key inflation report later today, which will shed light on the path of interest rates going forward. The Dow Jones closed flat at 38,889 while the S&P 500 added 0.1% to close at 5,209. The tech-heavy Nasdaq Composite was up 0.3% at 16,306.
NIFTY50
April Futures: 22,735 (▼0.06%)
Open Interest: 2,28,387 (▲9.11%)
The NIFTY50 extended its upmove and made a fresh record high on 9 April. However, during the second half of the trading session, profit-booking emerged at higher levels ahead of the release of crucial U.S. inflation data which will be released later today.
On 8 April, the index broke out of its month-long consolidation, closing above its previous all-time high (22,526). This zone will now act as immediate support zone for the NIFTY50. On hourly timeframe, we have highlighted crucial support and resistance levels for today’s expiry. A break adove or below this range will provide further directional clues to the traders.

Additionally, with critical data points like U.S. inflation and the fourth quarter result of TCS on horizon, traders should closely monitor the price action around crucial levels for further directional clues.
Open interest (OI) build-up for today’s expiry shows a significant call base at 23,000 and 22,800 strikes. On the other hand, the base of put writers is at 22,500 and 22,400 strikes. Based on the options data, traders are expecting NIFTY50 to trade between 22,400 and 22,850.

BANK NIFTY
April Futures: 48,799 (▲0.24%)
Open Interest: 1,30,423 (▼1.63%)
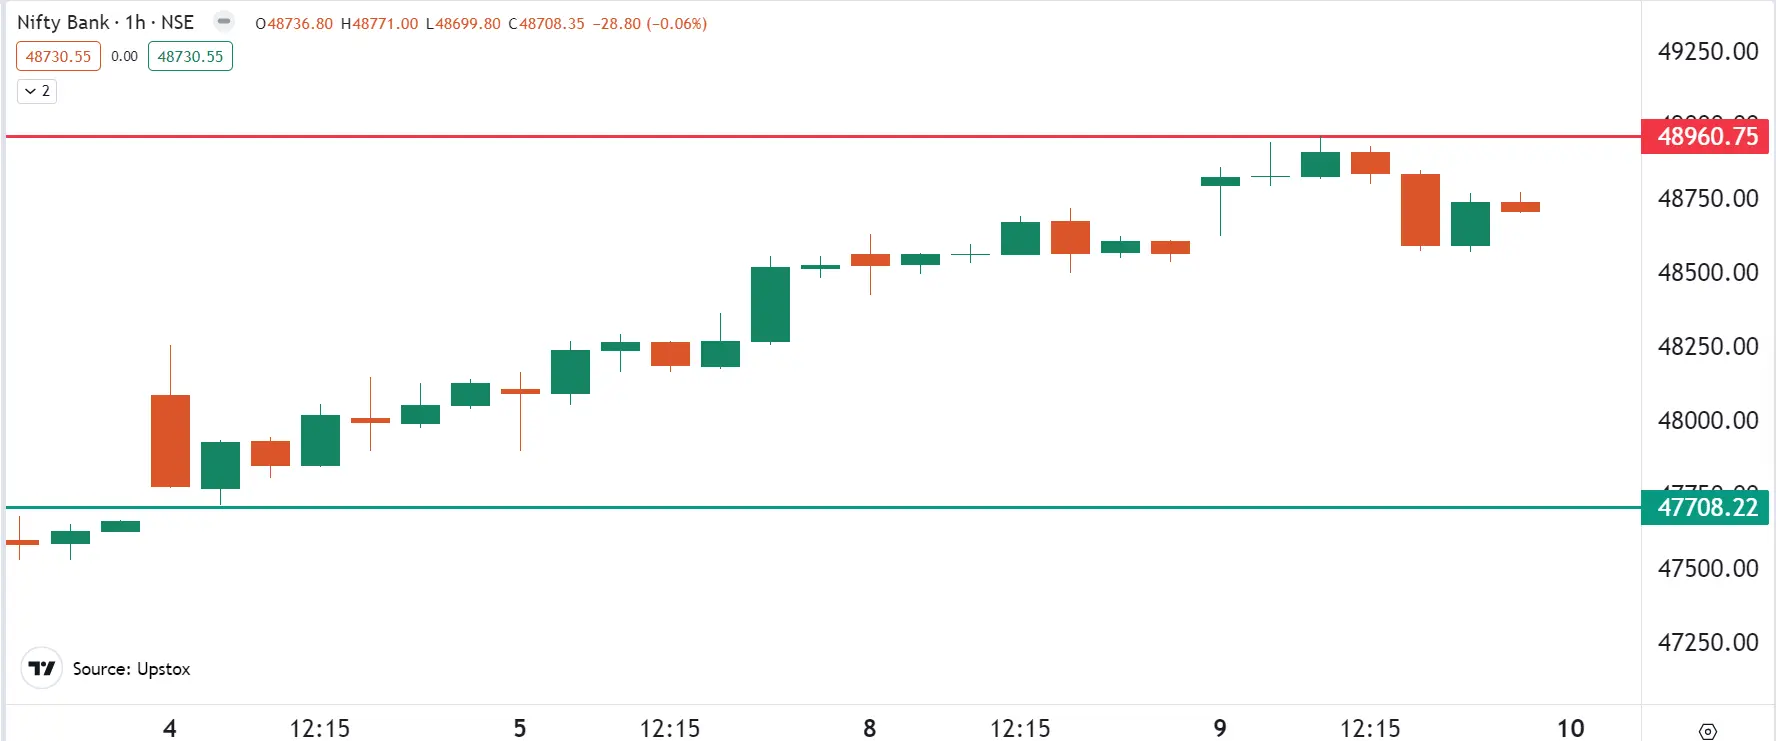
The BANK NIFTY also started Tuesday's session on a positive note, but came under selling pressure near its all-time high. However, the index managed to close above its previous all-time high (48,636) after three months, but formed a doji candle on the daily chart, indicating indecision among investors at higher levels.
The index has formed the second back-to-back doji on the daily chart, highlighting the range-bound activity following the positive start. As the doji is a neutral candlestick pattern, a break of the high and low of this candle (9th April) will provide traders more directional insights.
On the hourly chart, we have highlighted key support (47,700) and resistance (49,000) levels for today's expiry. Traders will want to keep a close eye on these key levels as a break above or below them will provide more directional signals.

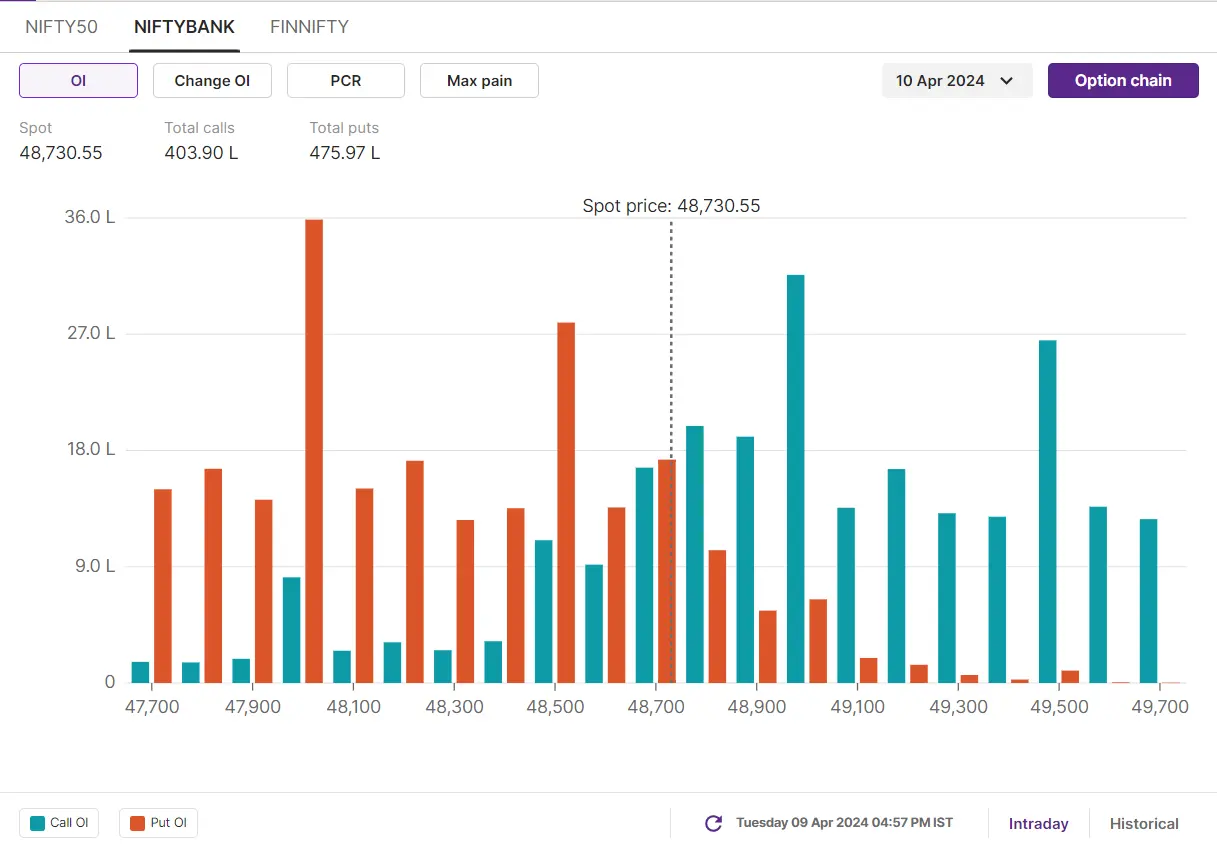
Open interest data suggests significant activity at the 49,000 & 49,500 call option strikes and the 48,000 & 48,500 put option strikes. This suggests that traders expect the BANK NIFTY to trade in a range of 47,700 & 49,200 for today's expiry.

FII-DII activity
Foreign Institutional Investors (FIIs) remained net sellers and sold shares worth ₹593 crore, while the Domestic Institutional Investors (DIIs) bought shares worth ₹2,257 crore. To track the ratio of long and short open positions of FIIs in the index, log in to https://pro.upstox.com/ ➡️F&O➡️FII-DII Activity➡️FII Derivatives
Stock scanner
Long build-up: Hindustan Copper, Exide Industries, Metropolis, Bharat Electronics, Page Industries and Petronet LNG
Short build-up: Bosch, Granules, REC, ACC and India Cements.
Under F&O ban: Exide Industries, Hindustan Copper, Idea, India Cements, Bandhan Bank, Steel Authority of India and Zee Entertainment
To access a specially curated smartlist of most traded and active stocks, as well as the OI gainers and losers, simply log in: https://pro.upstox.com/ ➡️F&O➡️Options smartlist/Futures smartlist
In Futures and Options or F&O, long build-up means an increase in Open Interest (OI) along with an increase in price, and short build-up means an increase in Open Interest(OI) along with a decrease in price.
Source: Upstox and NSE.
Disclaimer: Derivatives trading must be done only by traders who fully understand the risks associated with them and strictly apply risk mechanisms like stop-losses. The information is only for consumption by the client and such material should not be redistributed. We do not recommend any particular stock, securities and strategies for trading. The securities quoted are exemplary and are not recommendatory. The stock names mentioned in this article are purely for showing how to do analysis. Take your own decision before investing.