Market News
India VIX hits 52-week high: Understand correlation between VIX and markets in different scenarios
.png)
5 min read | Updated on May 07, 2024, 20:22 IST


SUMMARY
The India VIX serves as a vital indicator of market volatility, often referred to as the "fear index." It measures traders' expected short-term volatility in the Nifty50 index over the next 30 days. There exists an inverse correlation between the India VIX and Nifty 50, wherein high volatility typically coincides with market uncertainty and potential declines in stock prices. Conversely, low VIX levels indicate market stability and reduced fear among participants.
India VIX hits 52-week high; Analysing the correlation between VIX and markets in different scenarios
India VIX, commonly referred to as the gauge of volatility in the stock market or as the fear index, is a metric that measures the market’s expected short-term volatility. In a nutshell, it shows the expected annual volatility of traders over the next 30 days in the Nifty50 index.
For example, if India VIX is currently at 15, it means that it is expected to change by 15% over the next 30 days. The National Stock Exchange (NSE) introduced the VIX in 2008.
India VIX and Nifty 50 are closely related, but their relationship is often characterized by an indirect inverse correlation.
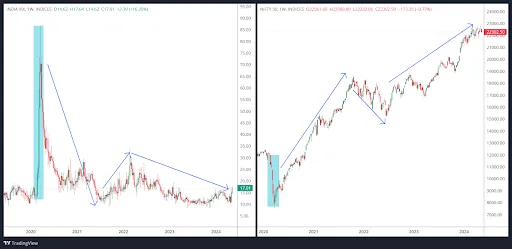
In the above chart, on the left pane, we have the India VIX and on the right-hand side of the pane, we have the Nifty price. You can check the inverse correlation as and when there is a period of sharp rise in the India VIX. In each of the instances, we have seen a fall in the prices of Nifty.
Generally, when market participants expect higher volatility (as indicated by a high India VIX), it can be associated with uncertainty and a potential decrease in stock prices, affecting the Nifty 50 negatively.
Therefore, there is an inverse correlation between India VIX and Nifty 50. When India VIX is high and rising (indicating higher expected volatility), Nifty 50 may experience declines, and vice versa).
Overall, India VIX and Nifty 50 are connected by expectations of market volatility. When India VIX is high, it usually means the market is more uncertain, which can lead to a downfall in the price of the Nifty 50 index. Traders and investors closely monitor this relationship to understand the market mood and make better decisions.
What happens when to Indian share market when the India VIX is above 20- Fear Rises
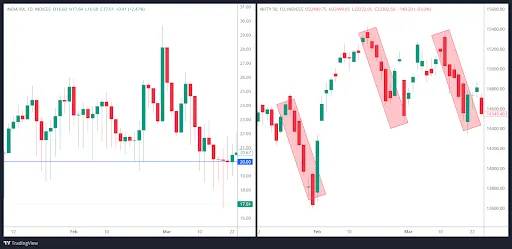
When the India VIX is higher, the volatility gauge stays above the threshold level of 20 indicating high market volatility as seen in the charts. On the left-hand side pane, the India VIX chart above the level of 20 is taken and on the right-hand side, the wild swings of the market are seen. It suggests increased fear and uncertainty in the market and you can see in the above chart that when the India VIX is above the threshold limit of the 20, there are wild swings in the Indian share market.
India VIX below 20- Fear subsidies
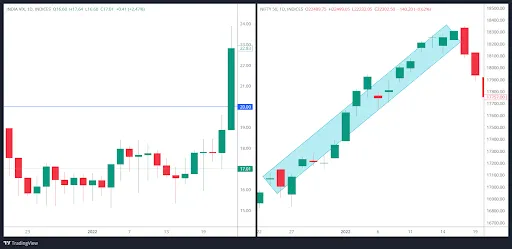
Similarly low VIX below the average threshold level of 20 indicates low market volatility or less fear among the market participants as seen in the charts. In the above chart, we can see during the period from June the India VIX stayed below the level of 20 and subsequently we have seen a rally in the Nifty. However, as soon as the India VIX crossed the 20-level threshold a correction was seen in the market.
Additionally, the VIX is a mean-reverting index, meaning that it tends to revert to its historical average over time. Extremely low or high VIX levels may not persist for extended periods.
We have captured the India VIX and Nifty50 trends during the previous two elections and have surprisingly found that the past two elections witnessed almost similar market sentiments. Pre-election VIX was in an uptrend and during the time of results markets were in consolidation. After the election outcome, VIX cooled off substantially as there was clarity, which suggests that market participants don’t appreciate uncertainty and when there is a sense of uncertainty, VIX tends to surge.
Case 1: 2014 Election Period

In the above chart, we can see that before the general elections of 2014, the India VIX rose as there was uncertainty among the market participants related to the outcome of the general elections and at the same time Nifty50 index witnessed significant volatility. However, once there was a clear mandate, hesitation perished. As a result, VIX cooled off and the Indian stock markets started to rally.
Case 2: 2019 Election Period

A similar trend was observed in the year 2019 just before the general election. India VIX started to pick up momentum and during this period it peaked as Indian markets were experiencing high volatility. However, after the outcome VIX cooled off and the bulls made a comeback.
Case 3: Covid-19 Pandemic
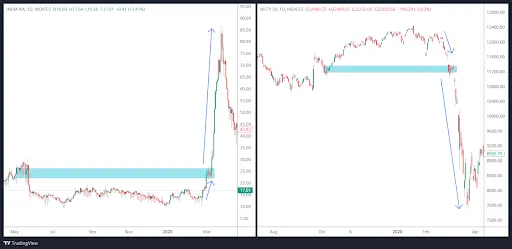
The chart below showcases how VIX initially increased during the COVID-19 pandemic. After some consolidation, it continued to increase to a high of 86.64. Simultaneously Nifty50 index plummeted due to increased fear leading to a massive selloff in the index.
The following chart is of the COVID-19 pandemic outbreak. It is evident from the chart below that after a period of a range bound activity in the India VIX, it began to rise during March and considering the inverse relationship with Nifty50, the index started to witness correction. Heightened volatility was seen as daily ranges expanded.
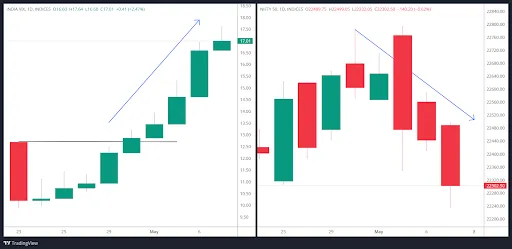
Case 4: Current scenario
In the current scenario, we saw a huge spike from the April 2024 lows in India VIX. Considering the inverse relation with the Nifty 50 index, we saw a correction in the index.
Conclusion
Overall, India VIX and Nifty 50 are connected by expectations of market volatility. When India VIX is high, it usually means the market is more uncertain, which can lead to a downfall in the price of the Nifty 50 index. Traders and investors closely monitor this relationship to understand the market mood and make better decisions.
About The Author
Next Story