Delhivery Share Price
Delhivery Share Price Today
As of 25 Jul 2026, Delhivery share price is ₹462.55. The stock opened at ₹463.00, compared to its previous close of ₹465.45. During today's trading session, Delhivery share price moved in the range of ₹458.15 to ₹466.80, with an average price of ₹462.48 for the day. Looking at its last 52-week, the stock has touched a low of ₹374.45 and a high of ₹524.00. On the performance front, Delhivery share price has increased by 19.49% over the last six months and is up 5.64% on a year-on-year basis.

Delhivery Returns Calculator
Delhivery Shareholder Returns
Delhivery Share Price History
| Name | Mkt Cap Cr | P/E | P/B | ROE | D/E | ROCE | Book Value | Div. Yield | Turnover | EPS(TTM) |

|---|---|---|---|---|---|---|---|---|---|---|
| Container Corp of India | 36,390.10 | 29.38 | 2.83 | 9.59% | 0.07 | 12.20% | 169.24 | 0.92% | 0.61 | 16.04 |
| AEGIS VOPAK TERMINALS LTD | 32,469.70 | 57.77 | 5.26 | 16.38% | 1.12 | 8.65% | 3.70 | 1.24% | 0.10 | 2.50 |
| SHADOWFAX TECHNOLOGIES L | 12,546.30 | 114.42 | 7.32 | 6.40% | 0.13 | 6.56% | 29.93 | 0.00% | 2.11 | 2.29 |
| Blue Dart Express | 11,312.90 | 45.73 | 6.37 | 15.79% | 0.32 | 15.63% | 771.64 | 0.51% | 2.72 | 101.02 |
| BLACKBUCK LIMITED | 9,822.73 | 62.00 | 6.99 | 11.28% | 0.02 | 11.58% | 78.17 | 0.00% | 0.44 | 8.97 |
| Tourism Finance Corporation of India | 7,053.87 | 15.49 | 2.75 | 19.48% | 0.10 | 19.75% | 2.97 | 1.09% | 1.61 | 57.89 |
| TVS Supply Chain Solutions | 5,878.72 | 35.15 | 1.98 | 8.45% | 0.14 | 9.19% | 1.51 | 0.00% | 0.71 | 0.45 |
| VRL Logistics | 4,258.84 | 17.26 | 3.58 | 21.27% | 1.07 | 17.44% | 3.58 | 2.14% | 1.47 | 13.54 |
| Mahindra Logistics | 3,896.96 | 81.48 | 3.32 | 0.28% | 0.38 | 6.33% | 148.80 | 0.64% | 1.97 | 4.78 |
| SINDHU TRADE LINKS LTD | 3,825.53 | 67.05 | 2.18 | 3.28% | 0.42 | 5.21% | 6.14 | 0.00% | 0.31 | 0.16 |
Delhivery Financials
Income Statement · Consolidated
| Particulars | Mar 2025 | Mar 2024 | Mar 2023 | Mar 2022 |
|---|---|---|---|---|
| Revenue | ₹8,931.90 | ₹8,141.54 | ₹7,225.30 | ₹6,882.29 |
| Other Income | ₹440.11 | ₹452.70 | ₹304.95 | ₹156.14 |
| Total Revenue | ₹9,372.01 | ₹8,594.23 | ₹7,530.25 | ₹7,038.43 |
| Total Expenses | ₹9,216.77 | ₹8,824.97 | ₹8,596.88 | ₹8,064.53 |
| Profit Before Tax | ₹157.13 | -₹244.45 | -₹1,053.06 | -₹1,029.33 |
| Tax | -₹4.98 | ₹4.74 | -₹45.28 | -₹18.33 |
| Profit After Tax | ₹162.11 | -₹249.19 | -₹1,007.78 | -₹1,011.00 |
| EPS - Basic | ₹2.19 | -₹3.40 | -₹14.09 | -₹16.98 |
| EPS - Diluted | ₹2.14 | -₹3.40 | -₹14.09 | -₹16.98 |
Cash Flow · Consolidated
| Particulars | Mar 2025 | Mar 2024 | Mar 2023 | Mar 2022 |
|---|---|---|---|---|
| Profit before tax | ₹157.13 | -₹244.45 | -₹1,053.06 | -₹1,029.33 |
| Income before WC changes | ₹617.47 | ₹494.59 | -₹22.11 | ₹268.09 |
| Change in Assets | -₹122.73 | -₹13.00 | ₹81.01 | -₹774.42 |
| Change in Liabilities | ₹97.81 | ₹28.08 | -₹17.00 | ₹278.98 |
| Change in WC | -₹24.92 | ₹15.08 | ₹64.01 | -₹495.44 |
| Cash flow from Operations | ₹567.36 | ₹472.40 | -₹29.70 | -₹240.53 |
| Cash flow from Investing | -₹103.61 | -₹99.09 | -₹3,410.75 | -₹2,742.13 |
| Cash flow from Financing | -₹432.27 | -₹366.08 | ₹3,538.48 | ₹2,901.79 |
| Total Cash Flow | ₹31.49 | ₹7.23 | ₹98.04 | -₹80.87 |
| Cash (Start of the year) | ₹302.99 | ₹295.45 | ₹194.99 | ₹275.86 |
| Cash (End of the year) | ₹335.97 | ₹302.99 | ₹295.45 | ₹194.99 |
Balance Sheet · Consolidated
| Particulars | Mar 2025 | Mar 2024 | Mar 2023 | Mar 2022 |
|---|---|---|---|---|
| Non-Current Assets | ₹6,111.01 | ₹5,502.84 | ₹4,250.43 | ₹4,290.82 |
| Current Assets | ₹5,952.13 | ₹5,950.19 | ₹6,963.00 | ₹3,959.98 |
| Total Assets | ₹12,063.14 | ₹11,453.02 | ₹11,213.43 | ₹8,250.80 |
| Current Liabilities | ₹1,408.05 | ₹1,346.52 | ₹1,305.23 | ₹1,501.90 |
| Net Current Asset | ₹4,544.07 | ₹4,603.66 | ₹5,657.78 | ₹2,458.08 |
| Non-Current Liabilities | ₹1,222.93 | ₹961.85 | ₹731.07 | ₹791.53 |
| Equity Capital | ₹9,432.15 | ₹9,144.65 | ₹9,177.14 | ₹5,957.37 |
| Total Equity & Liabilities | ₹12,063.14 | ₹11,453.02 | ₹11,213.43 | ₹8,250.80 |
Income Statement · Standalone
| Particulars | Mar 2025 | Mar 2024 | Mar 2023 | Mar 2022 |
|---|---|---|---|---|
| Revenue | ₹8,252.45 | ₹7,454.08 | ₹6,658.66 | ₹5,911.00 |
| Other Income | ₹456.39 | ₹475.35 | ₹331.17 | ₹169.86 |
| Total Revenue | ₹8,708.83 | ₹7,929.43 | ₹6,989.84 | ₹6,080.86 |
| Total Expenses | ₹8,509.45 | ₹8,023.50 | ₹7,790.83 | ₹6,942.19 |
| Profit Before Tax | ₹112.53 | -₹167.97 | -₹812.30 | -₹863.52 |
| Tax | ₹0.00 | ₹0.00 | ₹0.00 | ₹0.00 |
| Profit After Tax | ₹112.53 | -₹167.97 | -₹812.30 | -₹863.52 |
| EPS - Basic | ₹1.52 | -₹2.29 | -₹11.36 | -₹14.50 |
| EPS - Diluted | ₹1.49 | -₹2.29 | -₹11.36 | -₹14.50 |
Cash Flow · Standalone
| Particulars | Mar 2025 | Mar 2024 | Mar 2023 | Mar 2022 |
|---|---|---|---|---|
| Profit before tax | ₹112.53 | -₹167.97 | -₹812.30 | -₹863.52 |
| Income before WC changes | ₹620.81 | ₹520.33 | -₹23.97 | ₹265.31 |
| Change in Assets | -₹183.80 | ₹18.85 | -₹90.59 | -₹979.08 |
| Change in Liabilities | ₹114.60 | ₹8.06 | ₹145.79 | ₹279.83 |
| Change in WC | -₹69.20 | ₹26.91 | ₹55.20 | -₹699.25 |
| Cash flow from Operations | ₹528.33 | ₹521.37 | -₹40.30 | -₹440.95 |
| Cash flow from Investing | -₹106.66 | -₹147.07 | -₹3,428.46 | -₹2,894.76 |
| Cash flow from Financing | -₹430.45 | -₹363.75 | ₹3,556.61 | ₹3,246.67 |
| Total Cash Flow | -₹8.78 | ₹10.55 | ₹87.86 | -₹89.05 |
| Cash (Start of the year) | ₹262.21 | ₹251.66 | ₹163.80 | ₹252.85 |
| Cash (End of the year) | ₹253.43 | ₹262.21 | ₹251.66 | ₹163.80 |
Balance Sheet · Standalone
| Particulars | Mar 2025 | Mar 2024 | Mar 2023 | Mar 2022 |
|---|---|---|---|---|
| Non-Current Assets | ₹6,617.24 | ₹6,049.63 | ₹4,715.61 | ₹4,264.12 |
| Current Assets | ₹5,812.69 | ₹5,793.65 | ₹6,810.47 | ₹3,866.38 |
| Total Assets | ₹12,429.93 | ₹11,843.28 | ₹11,526.08 | ₹8,130.50 |
| Current Liabilities | ₹1,365.39 | ₹1,283.23 | ₹1,265.63 | ₹1,254.66 |
| Net Current Asset | ₹4,447.30 | ₹4,510.41 | ₹5,544.84 | ₹2,611.72 |
| Non-Current Liabilities | ₹1,208.99 | ₹940.55 | ₹690.12 | ₹718.69 |
| Equity Capital | ₹9,855.55 | ₹9,619.50 | ₹9,570.33 | ₹6,157.15 |
| Total Equity & Liabilities | ₹12,429.93 | ₹11,843.28 | ₹11,526.08 | ₹8,130.50 |
About Delhivery
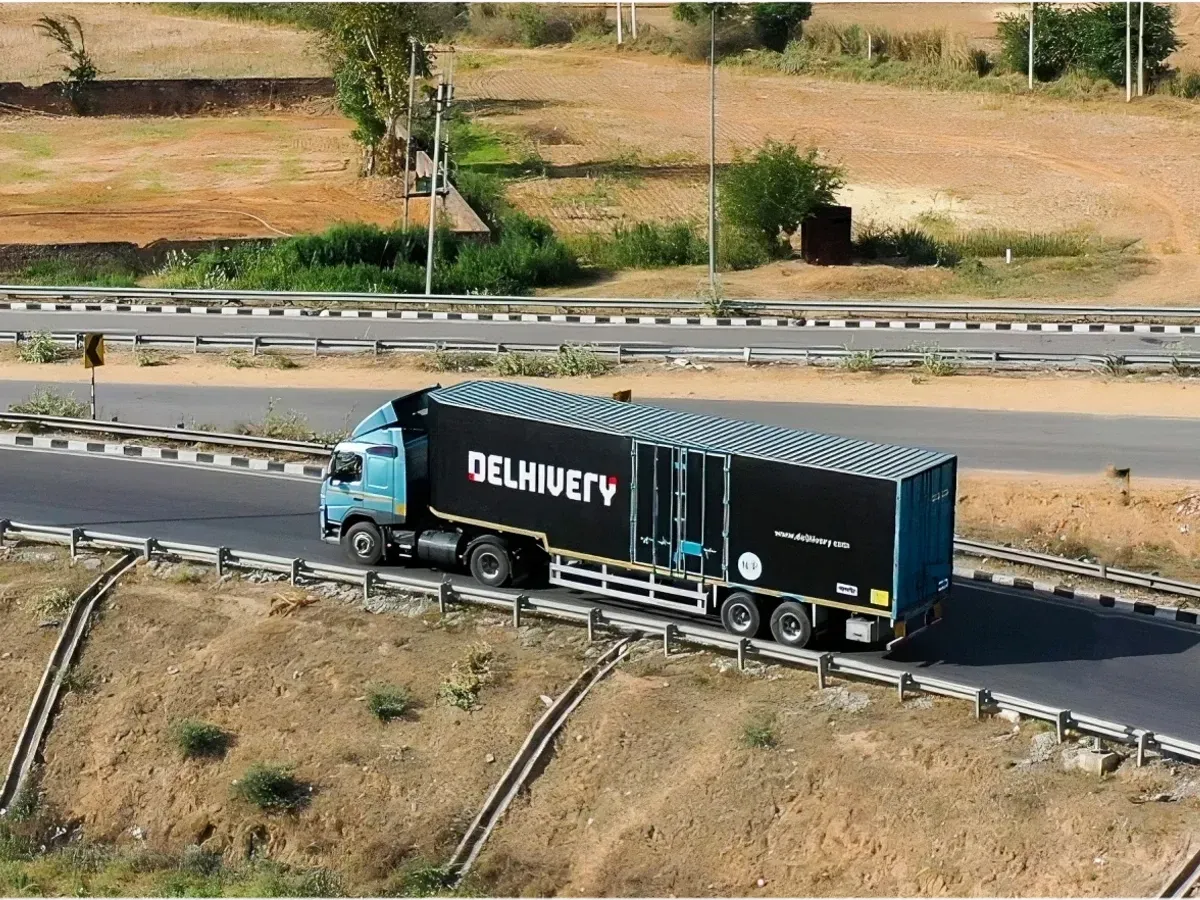
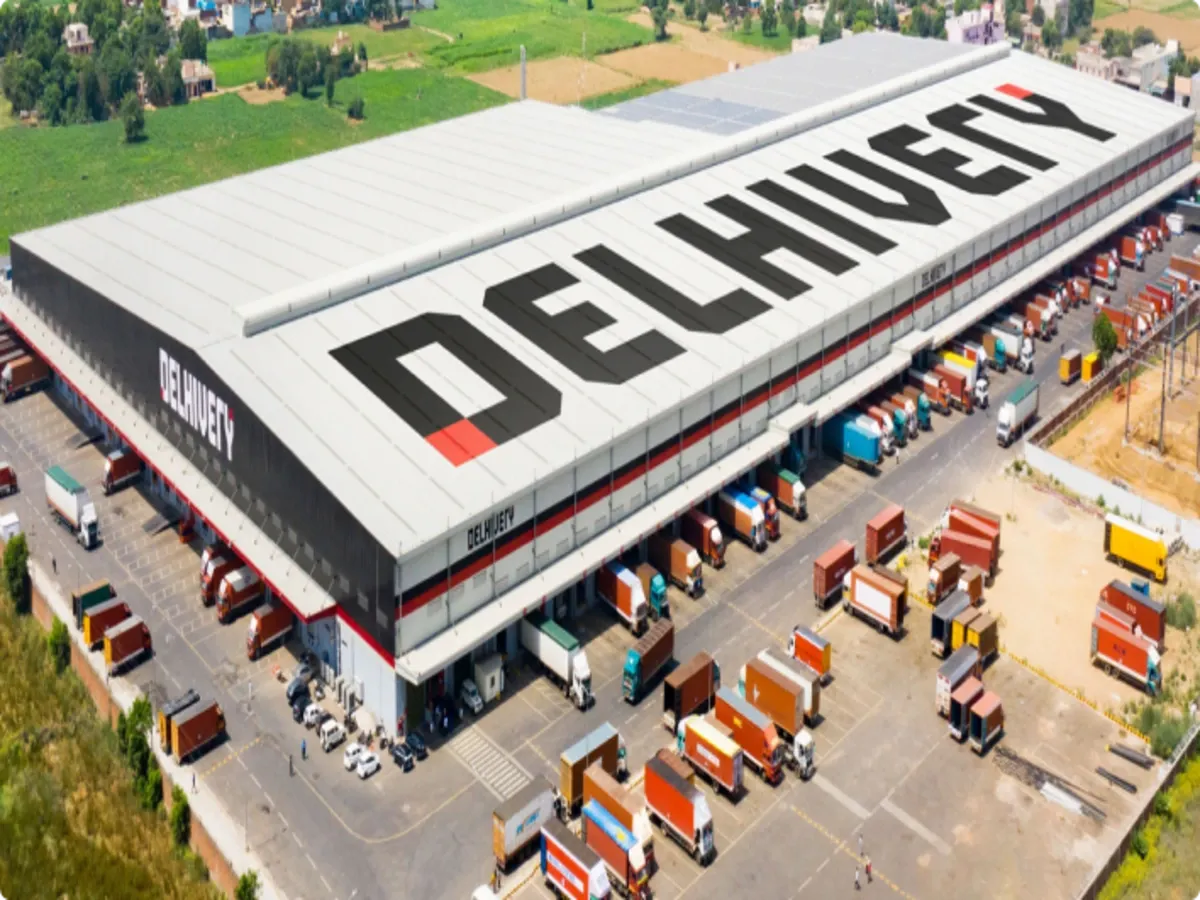
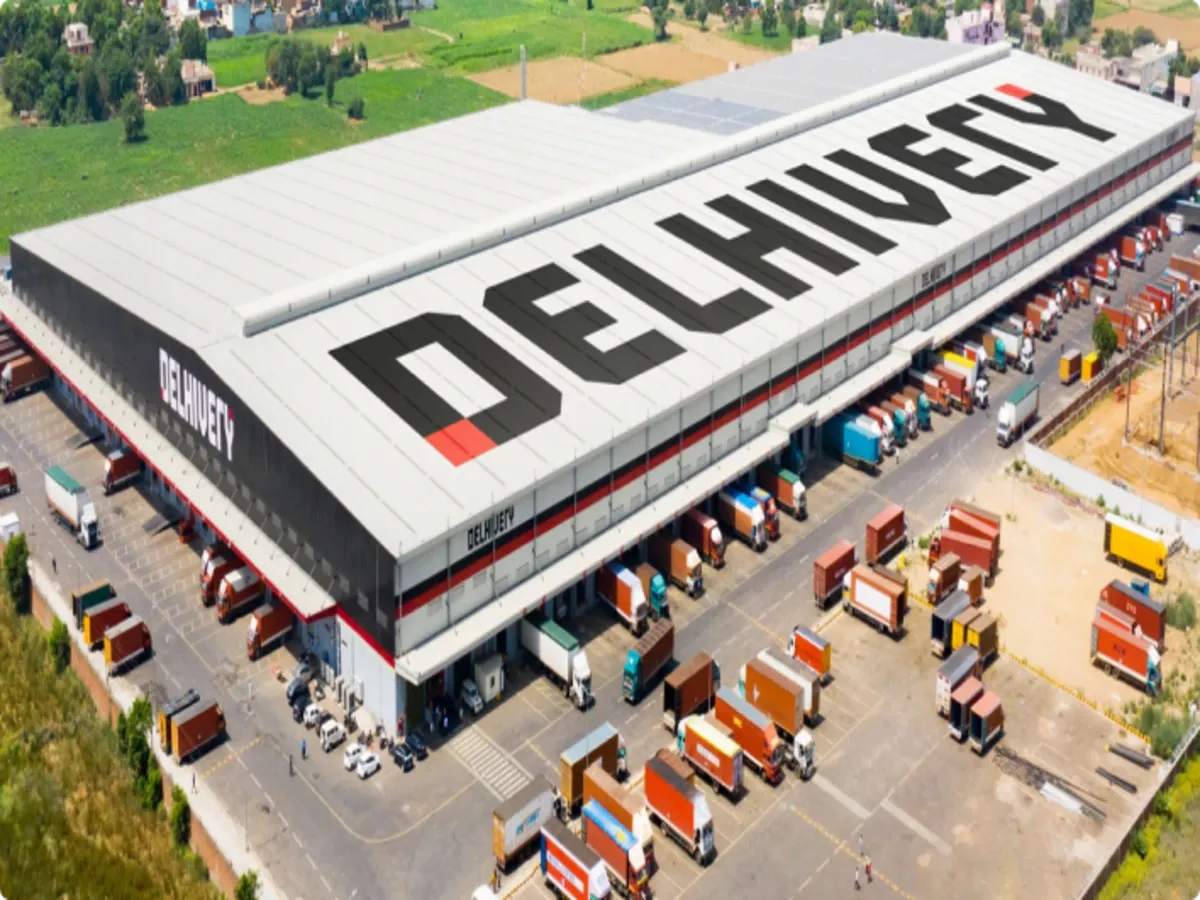
Delhivery is an integrated logistics provider offering a full range of services including express parcel, heavy goods delivery, part-truckload freight and truckload freight. The company was incorporated as SSN Logistics Private Limited in 2011. It was renamed to Delhivery Private Limited in 2015. As the company became a public entity in 2021, it was again renamed to Delhivery Limited with a fresh certificate of incorporation issued in October 2023.
In over 12 years of its inception, the company has successfully fulfilled over 2 billion orders using its network present in 18,600 pin codes across every state in India. Delhivery has 24 automated sorting centres, 94 gateways, 2880 direct delivery centres and a team of over 57,000 people.
Business operations
Delhivery also deals in supply chain software along with value-added services such as e-commerce return services, processing installation, assembly services, payment collection, and fraud detection. The company’s customer base includes e-commerce marketplaces, direct-to-consumer e-tailers and enterprises. SMEs across verticals like FMCGs, consumer durables and lifestyle depend on Delhivery.
The company uses its proprietary technology statement to offer integrated logistics services to customers. The technical infrastructure consists of more than 80 applications looking after all supply chain processes including order management, warehouse management, transportation management, financial transactions, tracking and supply chain analytics.
Delhivery started operations with the launch of the Transportation Management System (TMS) in 2011. Two years later, it started the business for fulfilment centres. In 2014, Delhivery introduced the network design tool Netplan product. It was followed up with the launch of the address resolution engine Addfix. The company also introduced automated sorting centres in its network.
Delhivery began offering part truckload services (PTL service offering) in 2016 along with the launch of its Constellation program. The year 2018 saw the company making an entry into the truckload services segment. It also began cross-border service offerings.
Delhivery introduced PaaS (Platform as a Service) as a soft launch in Sri Lanka and Bangladesh.
A year later, the company started its supply chain services and major acquisitions. It acquired Aramex's India assets and also announced a partnership with UPS. Delhivery announced its arrival in the global market with the opening up of its US office.
In 2020, the firm acquired Roadpiper Technologies Private Limited, a digital freight broker with fleet owner load-matching and pricing applications. Roadpiper was engaged in the business of providing technology solutions to the logistics industry along with end-to-end services to transportation companies.
In 2021, the company acquired the business of Primaseller Inc. In another acquisition, Delhivery took over Spoton Logistics Private Limited, an express PTL freight service provider in India.
Delhivery Ltd's market capitalisation stood at over ₹ 28,500 crore as of December 29, 2023. Delhivery share price has gained 17% in the last one year.
Delhivery Financial Highlights
- Revenue: Delhivery reported revenue of ₹10,866.96 crore in FY26 vs ₹9,372.01 crore in FY25. It showed an increase of 15.95% on a yearly basis.
- Operating Profit: Delhivery reported an operating profit of ₹140.42 crore in FY26 vs ₹157.13 crore in FY25. It showed a decrease of 10.63% on a year-on-year basis.
- Net Profit: Delhivery reported a net profit of ₹152.54 crore in FY26 vs ₹162.11 crore in FY25. It showed a decrease of 5.90% on a yearly basis.
Delhivery Quarterly Result Highlights
- Delhivery reported revenue of ₹2,909.42 crore in Mar 2026, compared with ₹2,882.11 crore in Dec 2025, representing an increase of 0.95% on a quarter-on-quarter (QoQ) basis.
- Delhivery reported an operating profit of ₹67.29 crore in Mar 2026, compared with ₹36.68 crore in Dec 2025, representing an increase of 83.45% on a quarter-on-quarter (QoQ) basis.
- Delhivery reported a profit of ₹72.40 crore in Mar 2026, compared with ₹39.59 crore in Dec 2025, reflecting an increase of 82.87% on a QoQ basis.
- The earnings per share (EPS) of Delhivery stood at ₹2.19 during Mar 2026.
Similar Stocks
FAQs on Delhivery Share Price
What is Delhivery share price today?
Delhivery share price is ₹462.55 as on 24 Jul, 2026, 15:56 IST.
How has the Delhivery share price performed in the past?
In the last 1 year, Delhivery delivered a return of 5.64%. The Delhivery share price hit a high of ₹524.00 and low of ₹374.45.
How much is the Mutual Fund shareholding in Delhivery shares?
The Mutual Fund Shareholding in Delhivery was 39.26% at the end of Jun 2026.
What is the the 52-week high and low of Delhivery shares ?
The 52-week high and low of Delhivery share is ₹524.00 and ₹374.45 as of 24 Jul, 2026.
What is the market cap of Delhivery?
The market capitalisation of Delhivery is ₹34,861.00 Crores as on 24 Jul, 2026.
What are the stock symbols of Delhivery?
The stock symbol of Delhivery is DELHIVERY on the NSE, 543529 on the BSE, and the ISIN is INE148O01028.
What was yesterday's closing price of Delhivery shares ?
Delhivery shares closed yesterday at ₹465.45 on NSE & ₹465.40 on BSE
How to buy Delhivery shares?
To buy Delhivery shares, open a demat account with Upstox and complete the KYC process. Once your account is set up, search for the stock and place your order.
Can I buy Delhivery shares on Holidays?
No, shares of Delhivery or any other publicly traded company cannot be bought or sold on holidays when the stock exchanges are closed. You can only buy or sell Delhivery shares on days when the stock exchanges are open for trading. It's important to check the NSE & BSE holidays calendar, before placing any trades to avoid any inconvenience.
What is the PE and PB ratio of Delhivery?
The PE and PB ratio of Delhivery is 226.74 and 3.58 respectively, as on 24 Jul, 2026, 15:56 IST.