Sun Pharmaceutical Industries Share Price
Sun Pharmaceutical Industries Share Price Today
As of 25 Jul 2026, Sun Pharmaceutical Industries share price is ₹1,942.90. The stock opened at ₹1,945.00, compared to its previous close of ₹1,954.00. During today's trading session, Sun Pharmaceutical Industries share price moved in the range of ₹1,934.80 to ₹1,959.80, with an average price of ₹1,947.30 for the day. Looking at its last 52-week, the stock has touched a low of ₹1,548.00 and a high of ₹1,966.50. On the performance front, Sun Pharmaceutical Industries share price has increased by 18.95% over the last six months and is up 14.72% on a year-on-year basis.
Sun Pharmaceutical Industries Returns Calculator
Sun Pharmaceutical Industries Shareholder Returns
Sun Pharmaceutical Industries Share Price History
| Name | Mkt Cap Cr | P/E | P/B | ROE | D/E | ROCE | Book Value | Div. Yield | Turnover | EPS(TTM) |
|---|---|---|---|---|---|---|---|---|---|---|
| Divis Laboratories | 1,92,376.00 | 61.36 | 9.40 | 16.19% | 0.00 | 21.00% | 9.43 | 0.50% | 0.58 | 98.19 |
| Torrent Pharmaceuticals | 1,88,655.00 | 66.03 | 17.03 | 26.76% | 1.05 | 18.30% | 16.90 | 0.90% | 0.49 | 64.75 |
| Cipla | 1,13,979.00 | 33.96 | 3.31 | 11.27% | 0.00 | 14.95% | 423.36 | 0.92% | 0.45 | 43.52 |
| Zydus Lifesciences | 1,10,613.00 | 17.39 | 3.23 | 19.69% | 0.35 | 20.30% | 3.70 | 0.11% | 0.39 | 35.38 |
| Lupin | 1,08,339.00 | 19.83 | 4.71 | 27.01% | 0.03 | 27.44% | 3.51 | 0.78% | 0.61 | 129.18 |
| Mankind Pharma | 1,03,472.00 | 1.05 | 0.12 | 12.65% | 0.42 | 12.97% | 5.05 | 0.05% | 0.54 | 49.37 |
| Dr. Reddy's Laboratories | 96,204.70 | 30.22 | 2.53 | 11.07% | 0.18 | 12.54% | 377.96 | 0.69% | 0.41 | 38.68 |
| Aurobindo Pharma | 88,508.40 | 25.39 | 2.35 | 9.25% | 0.19 | 11.76% | 391.14 | 0.26% | 0.48 | 41.58 |
| Laurus Labs | 86,564.20 | 79.36 | 16.33 | 16.77% | 0.40 | 16.14% | 97.21 | 0.12% | 0.64 | 13.72 |
| Biocon | 70,679.80 | 151.62 | 1.71 | 1.34% | 0.10 | 3.76% | 2.16 | 0.14% | 0.09 | 0.27 |
Sun Pharmaceutical Industries Financials
Income Statement · Consolidated
| Particulars | Mar 2026 | Mar 2025 | Mar 2024 | Mar 2023 |
|---|---|---|---|---|
| Revenue | ₹58,462.04 | ₹52,578.44 | ₹48,496.85 | ₹43,885.68 |
| Other Income | ₹3,211.90 | ₹2,150.57 | ₹1,390.32 | ₹634.52 |
| Total Revenue | ₹61,673.94 | ₹54,729.01 | ₹49,887.17 | ₹44,520.20 |
| Total Expenses | ₹45,247.58 | ₹40,299.03 | ₹38,304.96 | ₹34,940.32 |
| Profit Before Tax | ₹15,118.88 | ₹13,752.13 | ₹11,087.89 | ₹9,408.43 |
| Tax | ₹3,554.36 | ₹2,772.03 | ₹1,439.45 | ₹847.59 |
| Profit After Tax | ₹11,564.52 | ₹10,980.10 | ₹9,648.44 | ₹8,560.84 |
| EPS - Basic | ₹47.80 | ₹45.60 | ₹39.90 | ₹35.30 |
| EPS - Diluted | ₹47.80 | ₹45.60 | ₹39.90 | ₹35.30 |
Cash Flow · Consolidated
| Particulars | Mar 2026 | Mar 2025 | Mar 2024 | Mar 2023 |
|---|---|---|---|---|
| Profit before tax | ₹15,118.88 | ₹13,752.13 | ₹11,087.89 | ₹9,408.43 |
| Income before WC changes | ₹16,000.91 | ₹14,872.49 | ₹12,642.29 | ₹12,130.99 |
| Change in Assets | -₹2,270.62 | -₹1,845.34 | ₹567.80 | -₹2,371.18 |
| Change in Liabilities | ₹1,002.83 | ₹1,521.78 | ₹494.33 | -₹3,290.64 |
| Change in WC | -₹1,267.79 | -₹323.56 | ₹1,062.13 | -₹5,661.82 |
| Cash flow from Operations | ₹12,419.18 | ₹14,072.09 | ₹12,134.98 | ₹4,959.33 |
| Cash flow from Investing | -₹11,344.05 | -₹5,306.16 | -₹690.20 | -₹7,943.68 |
| Cash flow from Financing | -₹2,512.55 | -₹7,905.82 | -₹6,710.16 | ₹2,376.07 |
| Total Cash Flow | -₹1,437.42 | ₹860.11 | ₹4,734.62 | -₹608.28 |
| Cash (Start of the year) | ₹10,268.77 | ₹9,285.65 | ₹4,623.73 | ₹4,508.25 |
| Cash (End of the year) | ₹9,770.51 | ₹10,268.77 | ₹9,285.65 | ₹4,623.73 |
Balance Sheet · Consolidated
| Particulars | Mar 2026 | Mar 2025 | Mar 2024 | Mar 2023 |
|---|---|---|---|---|
| Non-Current Assets | ₹44,924.93 | ₹39,506.52 | ₹42,066.54 | ₹40,881.65 |
| Current Assets | ₹63,860.29 | ₹52,594.06 | ₹43,433.11 | ₹39,861.94 |
| Total Assets | ₹108,785.22 | ₹92,100.58 | ₹85,499.65 | ₹80,743.59 |
| Current Liabilities | ₹22,622.04 | ₹18,194.21 | ₹16,983.77 | ₹19,906.38 |
| Net Current Asset | ₹41,238.25 | ₹34,399.85 | ₹26,449.34 | ₹19,955.56 |
| Non-Current Liabilities | ₹2,283.44 | ₹1,420.42 | ₹1,389.94 | ₹1,521.74 |
| Equity Capital | ₹83,879.74 | ₹72,485.95 | ₹67,125.94 | ₹59,315.47 |
| Total Equity & Liabilities | ₹108,785.22 | ₹92,100.58 | ₹85,499.65 | ₹80,743.59 |
Income Statement · Standalone
| Particulars | Mar 2026 | Mar 2025 | Mar 2024 | Mar 2023 |
|---|---|---|---|---|
| Revenue | ₹20,754.64 | ₹22,977.40 | ₹20,275.17 | ₹20,812.14 |
| Other Income | ₹1,776.43 | ₹634.33 | ₹553.48 | ₹329.29 |
| Total Revenue | ₹22,531.07 | ₹23,611.73 | ₹20,828.65 | ₹21,141.43 |
| Total Expenses | ₹18,190.61 | ₹18,635.52 | ₹17,159.98 | ₹16,462.59 |
| Profit Before Tax | ₹3,794.12 | ₹4,976.21 | ₹3,449.65 | ₹1,741.05 |
| Tax | ₹1,170.70 | ₹748.13 | ₹591.47 | ₹50.33 |
| Profit After Tax | ₹2,623.42 | ₹4,228.08 | ₹2,858.18 | ₹1,690.72 |
| EPS - Basic | ₹10.90 | ₹17.60 | ₹11.90 | ₹7.00 |
| EPS - Diluted | ₹10.90 | ₹17.60 | ₹11.90 | ₹7.00 |
Cash Flow · Standalone
| Particulars | Mar 2026 | Mar 2025 | Mar 2024 | Mar 2023 |
|---|---|---|---|---|
| Profit before tax | ₹3,794.12 | ₹4,976.21 | ₹3,449.65 | ₹1,741.05 |
| Income before WC changes | ₹5,258.30 | ₹6,759.57 | ₹5,218.56 | ₹6,564.45 |
| Change in Assets | ₹1,307.69 | -₹2,967.65 | -₹1,188.02 | -₹3,599.99 |
| Change in Liabilities | ₹335.55 | ₹593.78 | -₹3,981.09 | -₹2,025.39 |
| Change in WC | ₹1,643.24 | -₹2,373.87 | -₹5,169.11 | -₹5,625.38 |
| Cash flow from Operations | ₹6,500.87 | ₹4,251.97 | -₹292.42 | ₹507.08 |
| Cash flow from Investing | -₹1,380.95 | -₹258.17 | -₹262.91 | -₹705.17 |
| Cash flow from Financing | -₹5,230.18 | -₹3,836.13 | ₹473.95 | ₹169.31 |
| Total Cash Flow | -₹110.26 | ₹157.67 | -₹81.38 | -₹28.78 |
| Cash (Start of the year) | ₹492.57 | ₹327.37 | ₹410.28 | ₹419.53 |
| Cash (End of the year) | ₹417.84 | ₹492.57 | ₹326.46 | ₹410.28 |
Balance Sheet · Standalone
| Particulars | Mar 2026 | Mar 2025 | Mar 2024 | Mar 2023 |
|---|---|---|---|---|
| Non-Current Assets | ₹26,380.82 | ₹25,097.77 | ₹26,152.25 | ₹24,543.74 |
| Current Assets | ₹16,678.72 | ₹18,780.70 | ₹14,912.54 | ₹16,443.75 |
| Total Assets | ₹43,059.54 | ₹43,878.47 | ₹41,064.79 | ₹40,987.49 |
| Current Liabilities | ₹6,503.24 | ₹18,202.38 | ₹4,444.51 | ₹8,365.44 |
| Net Current Asset | ₹10,175.48 | ₹578.32 | ₹10,468.03 | ₹8,078.31 |
| Non-Current Liabilities | ₹14,185.54 | ₹1,775.80 | ₹12,925.88 | ₹8,873.69 |
| Equity Capital | ₹22,370.76 | ₹23,900.29 | ₹23,694.40 | ₹23,748.36 |
| Total Equity & Liabilities | ₹43,059.54 | ₹43,878.47 | ₹41,064.79 | ₹40,987.49 |
About Sun Pharmaceutical Industries
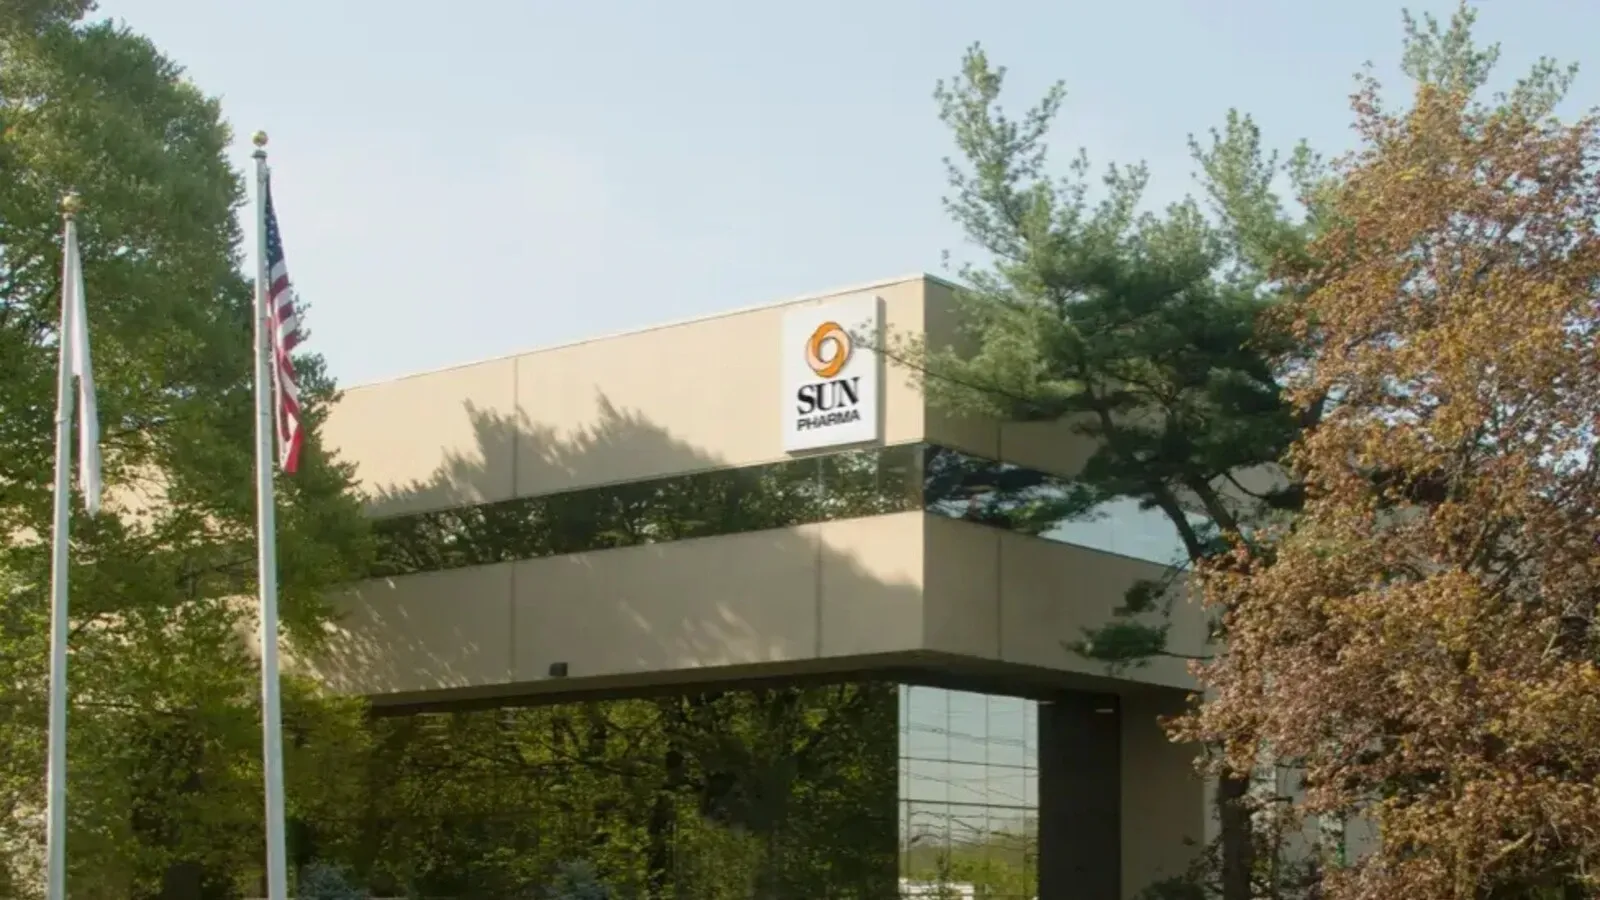
Sun Pharmaceutical Industries Ltd is the world’s fourth-largest specialty generic pharmaceutical company. With a network of over 40 manufacturing facilities, the company distributes medicines to more than over 100 countries worldwide. The company has a global employee base of over 41,000.
The company’s recent acquisition of Concert Pharmaceuticals Inc in the United States has granted it access to the late-stage asset deuruxolitinib, which has completed Phase-3 studies for treating alopecia areata. Founded in 1983, Sun Pharma has a market capitalisation of ₹2,98,705 crore as of December 19, 2023. Sun Pharma share price has gained 114% in the last 3 years.
Business portfolio
The company manufactures and markets a wide range of pharmaceutical formulations, which include generics, branded generics, over-the-counter, antiretrovirals, intermediates and active pharmaceutical ingredients. In specialty medications, Sun Pharma has a portfolio of patent-protected drugs. With focus on dermatology, ophthalmology and oncology, the company aims to improve patient outcomes by addressing unmet medical needs and enhancing convenience through diverse dosage forms.


Sun Pharma provides high-quality generic and branded medicines to patients and healthcare professionals in over 100 countries. These medicines are available in tablets, capsules, injectables, inhalers, ointments, creams and liquids.
The therapeutic segments covered by the company’s portfolio includes psychiatry, anti-infectives, neurology, cardiology, orthopaedics, diabetology, gastroenterology, ophthalmology, nephrology, urology, dermatology, gynaecology, respiratory, oncology, dental and nutritionals. Sun Pharma consistently ranks among the leading companies in these therapy areas. Presently, it’s one of the top companies in the United States, having introduced a number of speciality items.
When it comes to over-the-counter medications, Sun Pharma’s range is diverse. Its flagship OTC brands such as Faringosept (sore throat), Revital (vitamins) and Volini (topical analgesics) are available globally.
With regards to active pharmaceutical ingredients (APIs), Sun Pharma began producing them in 1995. The company manufactures more than 300 APIs that are sold in over 60 countries. These are manufactured in 14 sites spread across India, Hungary, the United States, Israel and Australia.
Sun Pharma provides a selection of antiretroviral (ARV) drugs that have been prequalified by the WHO. The company works with groups like the Clinton Health Access Initiative (CHAI) to lower the cost of triple medication combinations and provides ARVs to various National AIDS treatment programmes in Africa.
Bioequivalent ARV medications and APIs are produced at WHO-prequalified facilities in India, a PIC/S-approved facility in South Africa and a plant in Russia, all of which are part of Sun Pharma’s portfolio.
Sun Pharmaceutical Industries Financial Highlights
- Revenue: Sun Pharmaceutical Industries reported revenue of ₹60,433.76 crore in FY26 vs ₹54,543.48 crore in FY25. It showed an increase of 10.80% on a yearly basis.
- Operating Profit: Sun Pharmaceutical Industries reported an operating profit of ₹15,118.88 crore in FY26 vs ₹13,752.13 crore in FY25. It showed an increase of 9.94% on a year-on-year basis.
- Net Profit: Sun Pharmaceutical Industries reported a net profit of ₹11,564.52 crore in FY26 vs ₹10,980.10 crore in FY25. It showed an increase of 5.32% on a yearly basis.
Sun Pharmaceutical Industries Quarterly Result Highlights
- Sun Pharmaceutical Industries reported revenue of ₹15,070.29 crore in Mar 2026, compared with ₹16,099.38 crore in Dec 2025, representing a decrease of 6.39% on a quarter-on-quarter (QoQ) basis.
- Sun Pharmaceutical Industries reported an operating profit of ₹3,551.34 crore in Mar 2026, compared with ₹4,227.16 crore in Dec 2025, representing a decrease of 15.99% on a quarter-on-quarter (QoQ) basis.
- Sun Pharmaceutical Industries reported a profit of ₹2,723.72 crore in Mar 2026, compared with ₹3,401.09 crore in Dec 2025, reflecting a decrease of 19.92% on a QoQ basis.
- The earnings per share (EPS) of Sun Pharmaceutical Industries stood at ₹47.80 during Mar 2026.
Similar Stocks
FAQs on Sun Pharmaceutical Industries Share Price
What is Sun Pharmaceutical Industries share price today?
Sun Pharmaceutical Industries share price is ₹1,942.90 as on 24 Jul, 2026, 15:29 IST.
How has the Sun Pharmaceutical Industries share price performed in the past?
In the last 1 year, Sun Pharmaceutical Industries delivered a return of 14.72%. The Sun Pharmaceutical Industries share price hit a high of ₹1,966.50 and low of ₹1,548.00.
How much is the Mutual Fund shareholding in Sun Pharmaceutical Industries shares?
The Mutual Fund Shareholding in Sun Pharmaceutical Industries was 12.84% at the end of Jun 2026.
What is the the 52-week high and low of Sun Pharmaceutical Industries shares ?
The 52-week high and low of Sun Pharmaceutical Industries share is ₹1,966.50 and ₹1,548.00 as of 24 Jul, 2026.
What is the market cap of Sun Pharmaceutical Industries?
The market capitalisation of Sun Pharmaceutical Industries is ₹4,65,711.00 Crores as on 24 Jul, 2026.
What are the stock symbols of Sun Pharmaceutical Industries?
The stock symbol of Sun Pharmaceutical Industries is SUNPHARMA on the NSE, 524715 on the BSE, and the ISIN is INE044A01036.
What was yesterday's closing price of Sun Pharmaceutical Industries shares ?
Sun Pharmaceutical Industries shares closed yesterday at ₹1,954.00 on NSE & ₹1,954.05 on BSE
How to buy Sun Pharmaceutical Industries shares?
To buy Sun Pharmaceutical Industries shares, open a demat account with Upstox and complete the KYC process. Once your account is set up, search for the stock and place your order.
Can I buy Sun Pharmaceutical Industries shares on Holidays?
No, shares of Sun Pharmaceutical Industries or any other publicly traded company cannot be bought or sold on holidays when the stock exchanges are closed. You can only buy or sell Sun Pharmaceutical Industries shares on days when the stock exchanges are open for trading. It's important to check the NSE & BSE holidays calendar, before placing any trades to avoid any inconvenience.
What is the PE and PB ratio of Sun Pharmaceutical Industries?
The PE and PB ratio of Sun Pharmaceutical Industries is 36.73 and 5.05 respectively, as on 24 Jul, 2026, 15:29 IST.