Logo

Mahindra & Mahindra Share Price

NSE: M&M
|
Automobile
₹ 3,136.90
-₹38.50 (-1.21%)
1D
Last updated 03 Jul, 2026, 15:52 IST

Mahindra & Mahindra Share Price Today

As of 5 Jul 2026, Mahindra & Mahindra share price is ₹3,136.90. The stock opened at ₹3,194.00, compared to its previous close of ₹3,175.40. During today's trading session, Mahindra & Mahindra share price moved in the range of ₹3,127.30 to ₹3,197.00, with an average price of ₹3,162.15 for the day. Looking at its last 52-week, the stock has touched a low of ₹2,896.00 and a high of ₹3,839.90. On the performance front, Mahindra & Mahindra share price has declined by 17.50% over the last six months and is down 1.18% on a year-on-year basis.


₹3,127.30
1.21% down today
₹3,197.00
1D LOW
1D HIGH

Mahindra & Mahindra Returns Calculator

Open
₹3,194.00
High
₹3,197.00
Low
₹3,127.30
Prev. close
₹3,175.40

Circuit
L
H
₹2,823.30
₹3,450.50
52-week
L
H
₹2,896.00
₹3,839.90

Mahindra & Mahindra Shareholder Returns

Mahindra & Mahindra Share Price History

Mkt Cap Cr
3,94,603.00

P/E
21.19

P/B
4.24

ROE
18.37%

D/E
0.02

ROCE
14.63%

Div. Yield
1.01%

EPS(TTM)
130.18
Turnover
1.82

EV/EBITDA
11.67

Net Margin
0.00%

Op. Margin
0.00%

ROA
5.86%

Quick Ratio
0.00

Curr. Ratio
1.49
Based on fundamentals, this stock's
Step 5 of 5
Performance
Excellent
M & M outperforming all market indices
Step 3 of 5
Valuation
Fairly Valued
M & M appears to be fairly valued compared to its peers
Step 5 of 5
Earnings
Excellent
M & M revenue, operating profit and net profit are growing
Peer Comparison
Peer comparison — key ratios
NameMkt Cap CrP/EP/BROED/EROCEBook ValueDiv. YieldTurnoverEPS(TTM)
Maruti Suzuki4,51,199.0030.744.2113.70%0.0017.51%3,343.160.98%1.64459.46
Bajaj Auto2,75,567.0022.836.3228.57%0.0128.35%7.011.71%1.55352.00
Eicher Motors1,99,072.0036.107.9321.97%0.0127.17%794.471.13%0.94183.79
TVS Motor Company1,72,335.0052.9816.6735.27%0.2717.59%14.200.36%3.6576.09
TATA MOTORS LIMITED1,62,115.0047.9511.4034.02%0.4228.42%10.841.01%3.859.13
HYUNDAI MOTOR INDIA LTD1,58,450.0029.177.9227.14%0.0633.27%238.391.08%3.1065.50
Tata Motors1,27,417.001.330.9775.90%0.232.31%4.371.01%1.9714.26
Hero MotoCorp97,378.2016.864.5126.57%0.0133.40%1,078.403.80%2.03263.34
Ashok Leyland96,771.8026.036.7924.37%0.0912.51%22.332.12%2.876.07
ATHER ENERGY LIMITED43,802.20-84.6917.03-20.10%0.26-12.77%67.150.00%1.10-13.99

Mahindra & Mahindra Financials

Full statement

Income Statement · Consolidated

Income Statement · Consolidated — all values in INR Crore
ParticularsMar 2025Mar 2024Mar 2023Mar 2022
Revenue₹159,210.82₹139,078.27₹121,361.96₹90,170.57
Other Income₹2,181.05₹2,176.42₹1,166.95₹934.51
Total Revenue₹161,391.87₹141,254.69₹122,528.91₹91,105.08
Total Expenses₹143,849.67₹126,398.33₹111,223.64₹84,013.27
Profit Before Tax₹19,079.62₹15,977.79₹14,060.23₹9,361.77
Tax₹5,006.45₹3,707.97₹2,685.75₹2,108.76
Profit After Tax₹14,073.17₹12,269.82₹11,374.48₹7,253.01
EPS - Basic₹115.91₹101.14₹92.41₹59.20
EPS - Diluted₹115.06₹100.70₹91.96₹58.83

Cash Flow · Consolidated

Cash Flow · Consolidated — all values in INR Crore
ParticularsMar 2025Mar 2024Mar 2023Mar 2022
Profit before tax₹17,542.20₹14,856.36₹11,305.27₹7,091.81
Income before WC changes₹22,049.84₹17,541.24₹15,641.89₹10,514.71
Change in Assets-₹22,598.53-₹23,529.45-₹26,953.64-₹4,679.11
Change in Liabilities₹8,485.19₹4,354.36₹7,012.60₹4,972.37
Change in WC-₹14,113.34-₹19,175.09-₹19,941.04₹293.26
Cash flow from Operations₹3,175.81-₹5,629.95-₹7,074.02₹9,247.55
Cash flow from Investing-₹18,626.11-₹5,597.77-₹8,547.26-₹3,225.82
Cash flow from Financing₹15,834.11₹12,281.41₹15,946.11-₹5,882.60
Total Cash Flow₹383.81₹1,053.69₹324.83₹139.13
Cash (Start of the year)₹4,530.10₹3,493.41₹3,487.59₹3,374.59
Cash (End of the year)₹4,923.89₹4,530.10₹3,493.41₹3,487.59

Balance Sheet · Consolidated

Balance Sheet · Consolidated — all values in INR Crore
ParticularsMar 2025Mar 2024Mar 2023Mar 2022
Non-Current Assets₹151,013.00₹138,035.09₹114,566.33₹98,964.80
Current Assets₹126,573.27₹98,265.64₹91,325.44₹75,148.00
Total Assets₹277,586.27₹236,300.73₹205,891.77₹174,112.80
Current Liabilities₹90,322.01₹75,545.65₹70,579.41₹56,288.33
Net Current Asset₹36,251.26₹22,719.99₹20,746.03₹18,859.67
Non-Current Liabilities₹98,166.26₹83,245.74₹68,230.25₹60,999.21
Equity Capital₹89,098.00₹77,509.34₹67,082.11₹56,825.26
Total Equity & Liabilities₹277,586.27₹236,300.73₹205,891.77₹174,112.80

Income Statement · Standalone

Income Statement · Standalone — all values in INR Crore
ParticularsMar 2025Mar 2024Mar 2023Mar 2022
Revenue₹118,624.53₹101,335.77₹86,644.63₹57,786.94
Other Income₹1,711.87₹1,956.08₹923.71₹2,053.75
Total Revenue₹120,336.40₹103,291.85₹87,568.34₹59,840.69
Total Expenses₹104,686.28₹89,834.07₹78,008.02₹53,484.04
Profit Before Tax₹15,650.12₹13,457.78₹8,130.78₹6,147.98
Tax₹3,795.16₹2,815.49₹1,582.14₹1,278.10
Profit After Tax₹11,854.96₹10,642.29₹6,548.64₹4,869.88
EPS - Basic₹98.80₹88.79₹54.70₹40.73
EPS - Diluted₹98.45₹88.45₹54.49₹40.58

Cash Flow · Standalone

Cash Flow · Standalone — all values in INR Crore
ParticularsMar 2025Mar 2024Mar 2023Mar 2022
Profit before tax₹15,650.12₹13,457.78₹9,560.32₹6,356.65
Income before WC changes₹17,556.49₹13,490.63₹10,680.13₹7,183.90
Change in Assets-₹3,446.47-₹941.26-₹5,281.46-₹2,538.79
Change in Liabilities₹6,048.72₹1,824.75₹5,668.58₹2,930.05
Change in WC₹2,602.25₹883.49₹387.12₹391.26
Cash flow from Operations₹16,617.20₹11,473.64₹9,129.30₹6,976.73
Cash flow from Investing-₹13,874.02-₹5,384.02-₹4,753.48-₹3,963.59
Cash flow from Financing-₹3,354.84-₹5,546.57-₹3,783.75-₹3,165.98
Total Cash Flow-₹611.66₹543.05₹592.07-₹152.84
Cash (Start of the year)₹1,876.03₹1,310.11₹717.26₹867.54
Cash (End of the year)₹1,264.39₹1,876.03₹1,310.11₹717.26

Balance Sheet · Standalone

Balance Sheet · Standalone — all values in INR Crore
ParticularsMar 2025Mar 2024Mar 2023Mar 2022
Non-Current Assets₹51,985.01₹48,188.63₹41,136.18₹40,380.61
Current Assets₹47,663.90₹35,519.93₹34,643.63₹26,225.89
Total Assets₹99,648.91₹83,708.56₹75,779.81₹66,606.50
Current Liabilities₹32,079.79₹25,941.68₹26,039.99₹18,980.72
Net Current Asset₹15,584.11₹9,578.25₹8,603.64₹7,245.17
Non-Current Liabilities₹5,984.02₹5,475.70₹6,383.09₹9,427.73
Equity Capital₹61,585.10₹52,291.18₹43,356.73₹38,198.05
Total Equity & Liabilities₹99,648.91₹83,708.56₹75,779.81₹66,606.50
* All values are in INR Crore
Qty
Bid
20
3136.9
0
0
0
0
0
0
0
0
Ask
Qty
0
0
0
0
0
0
0
0
0
0
Bid Total: 20
Ask Total: 0
Buy orders: 100%
Sell orders: 0%
Bearish
1
Neutral
6
Bullish
1
Neutral
by SEBI experts
Expert Pick
EXPPICK
Stop-loss
Entry price
Target
Indicator
Value
Verdict

RSI (14)
53.41
Neutral

ATR (14)
78.33
Neutral

STOCH(9,6)
60.98
Neutral

STOCH RSI (14)
58.8
Neutral

ADX(9)
19.86
Bullish

UO(9)
48.72
Neutral

ROC(12)
-0.03
Bearish

WillR(14)
-39.02
Neutral
Period
Simple value
Exponential vaue

5D
3120.82
3130.79

10D
3102.63
3114.15

20D
3078.04
3098.65

50D
3105.49
3117.36

100D
3192.82
3201.84

About Mahindra & Mahindra

Mahindra & Mahindra logo
ISIN
INE101A01026
Sector Market Cap
₹ 3,94,603 Cr

Mahindra and Mahindra Limited is an Indian multinational automobile manufacturing company. Originally established in 1945 as Mahindra & Mohammed, it was later renamed Mahindra and Mahindra. The company’s diverse business portfolio includes automotive, farm equipment, technology services, financial services, renewable energy, logistics, hospitality and real estate. Headquartered in Mumbai, M&M is a core unit within the Mahindra Group.

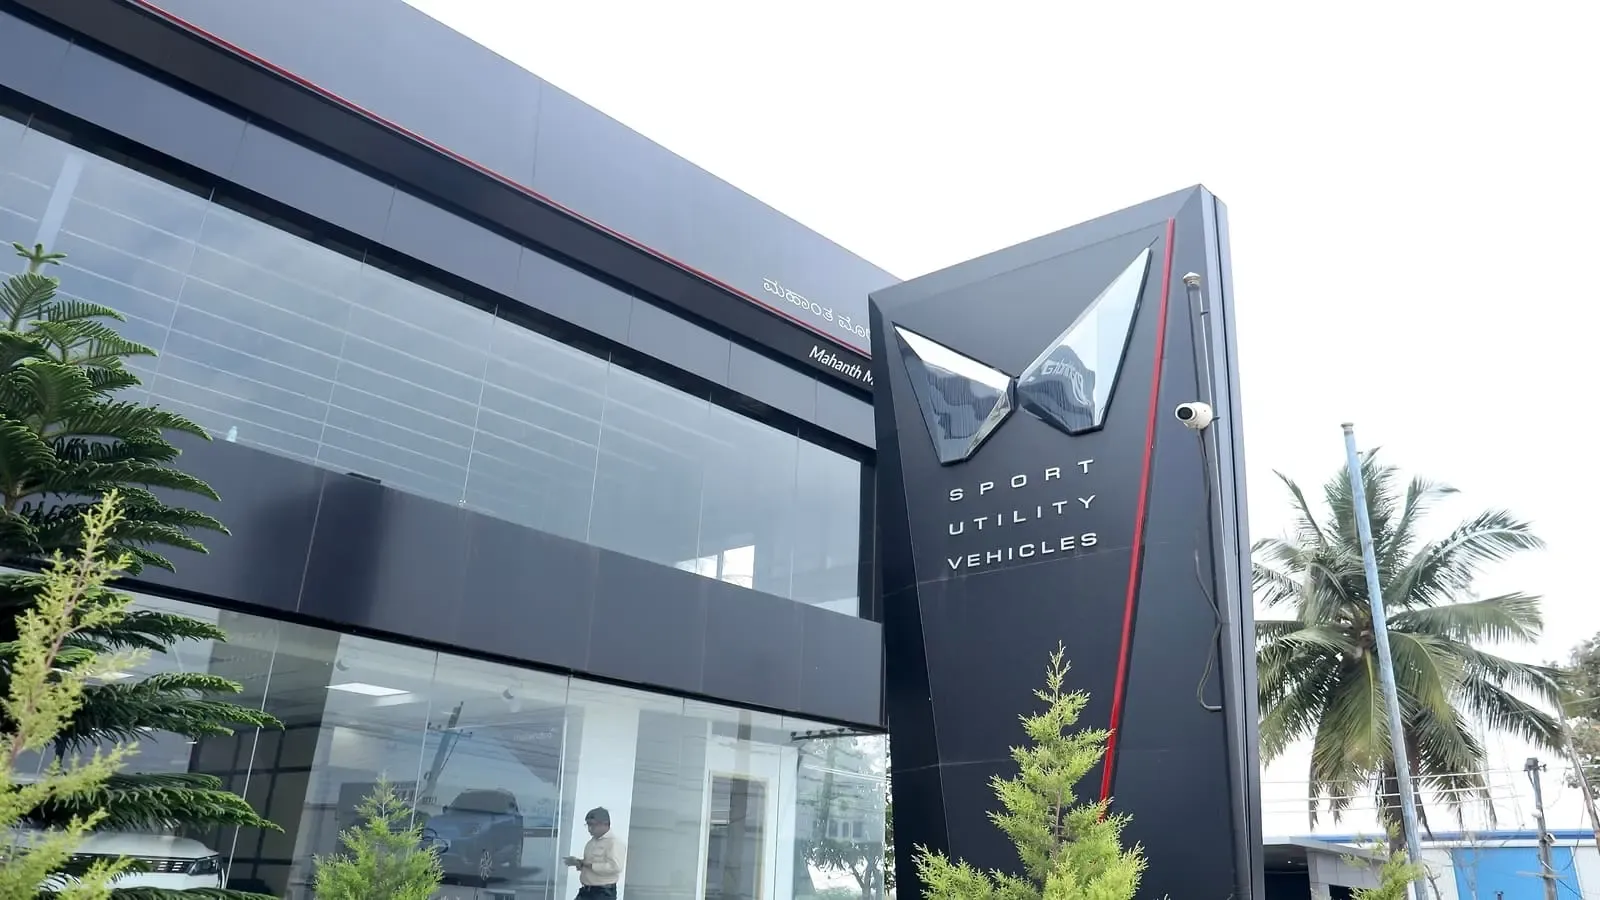
Since assembling its first vehicle in 1947, the company has grown rapidly. Today, it offers a wide range of products and solutions ranging from SUVs, pickups, commercial vehicles and tractors, to electric vehicles, two-wheelers, gensets and construction equipment. It started its exports in the 1960s, and currently, Mahindra and Mahindra Limited's vehicles and tractors can be found on six continents of the world.

The market capitalisation of Mahindra And Mahindra Limited is ₹200,000 crore as of January 30, 2024. Mahindra And Mahindra Limited share price has gained 110% in the last three years.

Business operations

Mahindra and Mahindra (M&M) Limited operates in nine segments. The automotive segment includes sales of automobiles, spare parts and related services. The farm equipment segment includes sales of tractors, spare parts and other services. The information technology (IT) services segment consists of services for IT and telecom. The financial services segment includes services relating to financing, leasing and purchasing of automobiles and tractors.

The steel trading and processing segment engages in the trading and processing of steel. The infrastructure segment operates commercial complexes, project management and development. Its other segments include logistics, after-market, two-wheelers and investment.

Mahindra And Mahindra Limited's unit, Mahindra Tractors, is the world's largest tractor manufacturer by volume. In India, it is the top SUV manufacturer basis a strong revenue market share. The company also enjoys leadership across various sectors, including farm equipment, utility vehicles, information technology and financial services within the country.

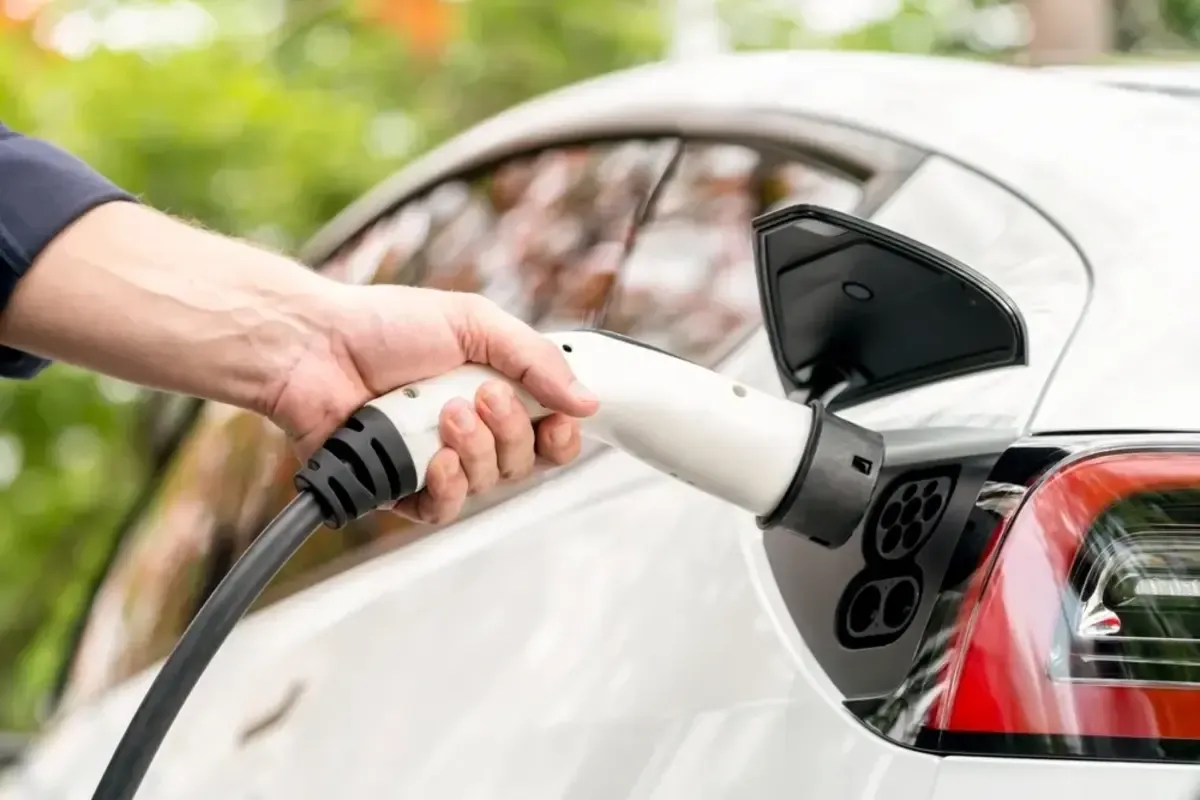
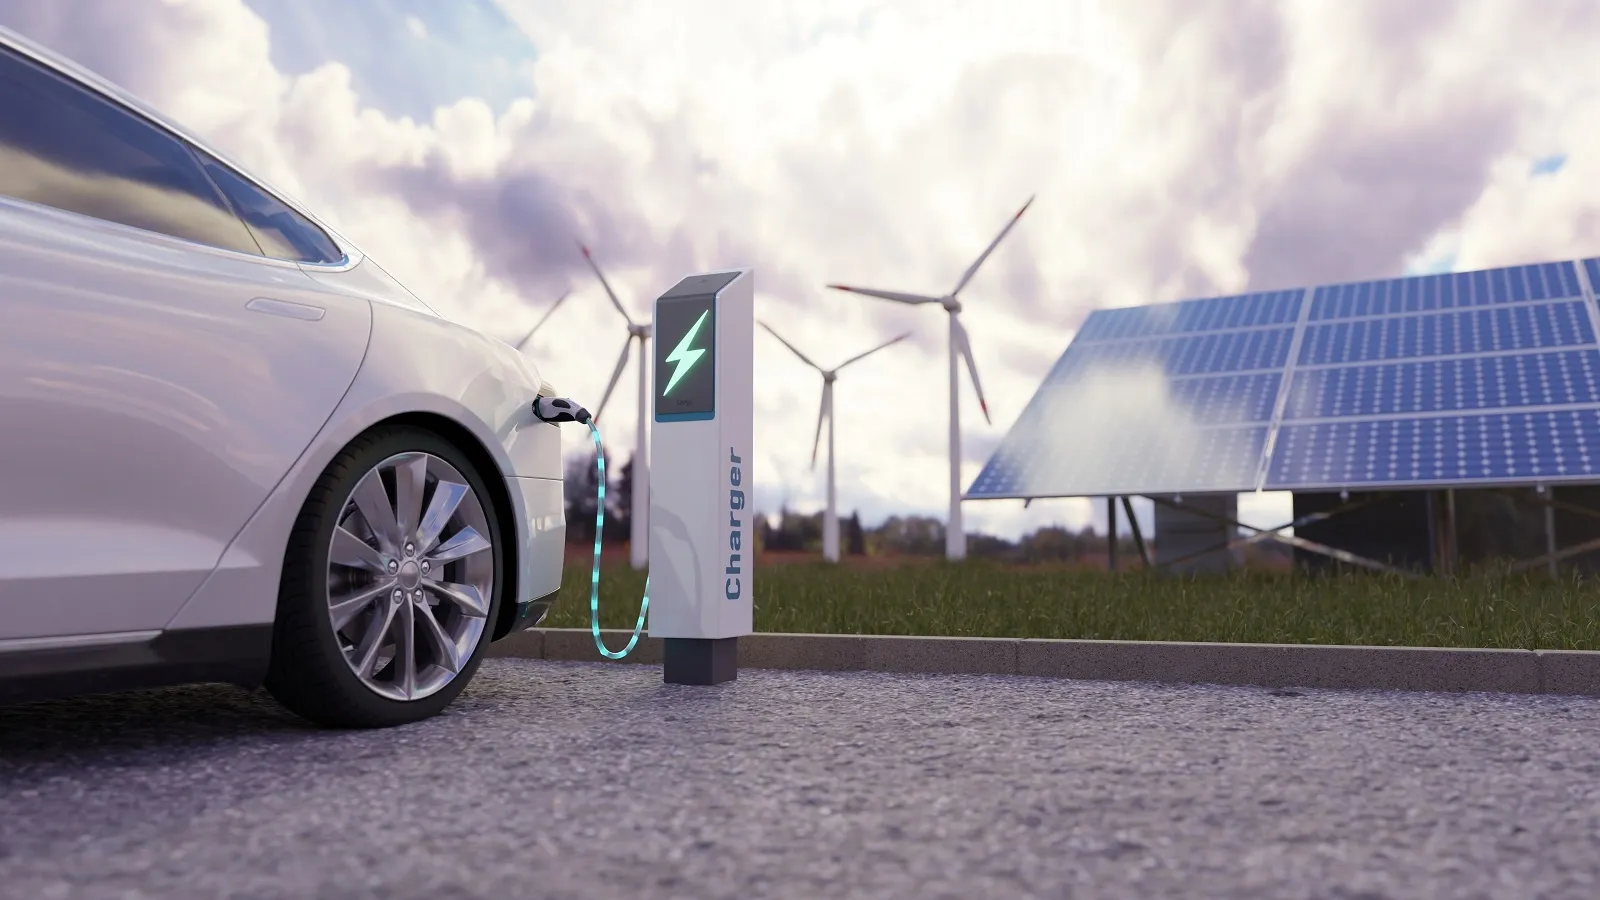
The company produced the world's first all-electric hypercar, the Pininfarina Battista, and is the only Indian original equipment manufacturer (OEM) competing in the Formula E All-Electric Car Racing Championship. Mahindra And Mahindra Limited caters to over 20 key industries and its services are available in over 100 countries.

The company operates 67 manufacturing facilities worldwide, with key centres in the UK and the USA. In the UK, it has a global design centre alongside collaborations in electric racing technology with Mahindra Racing and Two-Wheeler Technology with BSA. Its presence in the USA includes automotive & EV technologies with MRV located in Detroit.

The company's R&D facilities are strategically located in 21 centres across seven countries including India, Finland, Italy, Japan, Turkey, the UK and the USA. It also operates 21 manufacturing plants in India.

In the automotive sector, the company achieved a sales volume of 6,98,456 units in FY23, reflecting its strong market presence and consumer demand. It recorded a sales volume of 4,07,545 units in the farm equipment sector.

Mahindra & Mahindra Financial Highlights

  • Revenue: Mahindra & Mahindra reported revenue of ₹2,02,084.34 crore in FY26 vs ₹1,61,391.87 crore in FY25. It showed an increase of 25.21% on a yearly basis.
  • Operating Profit: Mahindra & Mahindra reported an operating profit of ₹25,184.76 crore in FY26 vs ₹19,079.62 crore in FY25. It showed an increase of 32.00% on a year-on-year basis.
  • Net Profit: Mahindra & Mahindra reported a net profit of ₹18,621.71 crore in FY26 vs ₹14,073.17 crore in FY25. It showed an increase of 32.32% on a yearly basis.

Mahindra & Mahindra Quarterly Result Highlights

  • Mahindra & Mahindra reported revenue of ₹55,976.75 crore in Mar 2026, compared with ₹52,958.27 crore in Dec 2025, representing an increase of 5.70% on a quarter-on-quarter (QoQ) basis.
  • Mahindra & Mahindra reported an operating profit of ₹6,914.10 crore in Mar 2026, compared with ₹6,568.62 crore in Dec 2025, representing an increase of 5.26% on a quarter-on-quarter (QoQ) basis.
  • Mahindra & Mahindra reported a profit of ₹5,259.91 crore in Mar 2026, compared with ₹5,021.47 crore in Dec 2025, reflecting an increase of 4.75% on a QoQ basis.
  • The earnings per share (EPS) of Mahindra & Mahindra stood at ₹115.91 during Mar 2026.
Know more
Promoters
18.45%
FII
36.22%
Other DII
14.26%
Retail and other
13.82%
Mutual funds
17.25%
Foreign institutions - FII
Compare against other stocks
Mahindra & Mahindra logo
Mahindra & Mahindra
Automobile
Add Stock
Add Another

FAQs on Mahindra & Mahindra Share Price